The Cost to Charge an Electric Vehicle: Public vs. At-Home Charging


Key takeaways
- The average cost to charge an electric vehicle (EV) publicly or commercially is 34.2 cents per kilowatt-hour (kWh).
- The cost of public and commercial EV charging is highest in Hawaii (55.8 cents per kWh), West Virginia (47.3 cents) and Montana (45.3 cents).
- The cost of public and commercial EV charging is lowest in Kansas (22.0 cents per kWh), Nebraska (24.6 cents), and Missouri and Maryland (both at 25.4 cents).
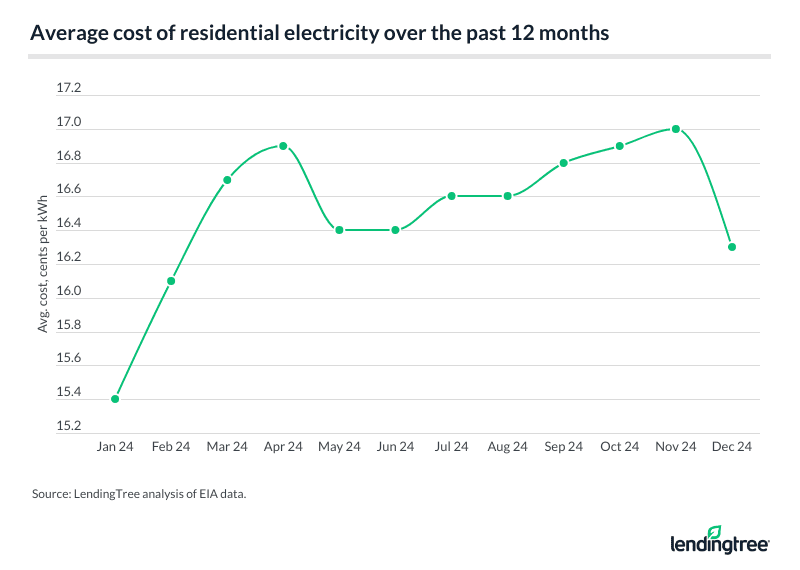
- The average cost of residential electricity (relevant for at-home EV charging) is 16.3 cents per kWh. In 2024, this figure peaked at 17.0 cents per kWh in November.
- The most expensive states for at-home EV charging are Hawaii (42.3 cents per kWh), Massachusetts (31.2 cents) and California (30.6 cents).
- The least expensive states for at-home EV charging are North Dakota (10.2 cents per kWh), Nebraska (10.8 cents), and Idaho and Utah (both at 11.0 cents).
- Public charging is 288.2% more expensive than home charging in Idaho, ahead of Montana (280.7%) and Arkansas (261.5%).
- Public charging is only 2.9% more expensive than home charging in Massachusetts, with California (15.4%) and Hawaii (31.9%) closest.
You may save on fuel costs when switching to an electric vehicle, but the cost of charging an EV varies widely. The latest LendingTree analysis finds that the average cost to charge an EV ranges from 16.3 cents per kWh at home charging stations to 34.2 cents at public and commercial charging stations.
Cost to charge an EV at public/commercial stations
The average cost to charge an EV at U.S. public and commercial stations was 34.2 cents per kWh as of Feb. 27, 2025. (AAA includes Level 1, Level 2 and Level 3/DC fast charging in the calculation.)
By state, public and commercial charging costs are highest in Hawaii (55.8 cents per kWh), West Virginia (47.3 cents) and Montana (45.3 cents).
States with the highest average public and commercial EV charging costs
| Rank | State | Avg. cost, cents per kWh |
|---|---|---|
| 1 | Hawaii | 55.8 |
| 2 | West Virginia | 47.3 |
| 3 | Montana | 45.3 |
Conversely, public and commercial charging costs are lowest in Kansas (22.0 cents), Nebraska (24.6 cents), and Missouri and Maryland (both at 25.4 cents).

Full rankings: States with the highest/lowest average public and commercial EV charging costs
| Rank | State | Avg. cost, cents per kWh |
|---|---|---|
| 1 | Hawaii | 55.8 |
| 2 | West Virginia | 47.3 |
| 3 | Montana | 45.3 |
| 4 | Idaho | 42.7 |
| 5 | Arkansas | 42.3 |
| 6 | New Hampshire | 42.0 |
| 6 | Tennessee | 42.0 |
| 8 | Kentucky | 41.6 |
| 9 | Alaska | 41.2 |
| 9 | South Carolina | 41.2 |
| 11 | Louisiana | 40.2 |
| 12 | Georgia | 39.5 |
| 13 | New Jersey | 39.4 |
| 13 | Oklahoma | 39.4 |
| 15 | Alabama | 39.1 |
| 16 | Rhode Island | 38.7 |
| 17 | Pennsylvania | 37.9 |
| 18 | Nevada | 37.8 |
| 19 | Connecticut | 37.6 |
| 19 | Maine | 37.6 |
| 19 | Mississippi | 37.6 |
| 22 | Wyoming | 37.5 |
| 23 | Illinois | 37.2 |
| 24 | Ohio | 36.9 |
| 25 | Indiana | 36.5 |
| 26 | New Mexico | 36.1 |
| 27 | Oregon | 36.0 |
| 28 | District of Columbia | 35.9 |
| 29 | Minnesota | 35.5 |
| 30 | Florida | 35.4 |
| 31 | California | 35.3 |
| 32 | Arizona | 35.2 |
| 33 | Wisconsin | 35.1 |
| 34 | New York | 34.6 |
| 35 | Virginia | 34.5 |
| 36 | North Carolina | 33.7 |
| 37 | Washington | 33.2 |
| 38 | Vermont | 32.3 |
| 39 | Massachusetts | 32.1 |
| 40 | Colorado | 31.8 |
| 41 | South Dakota | 31.7 |
| 42 | North Dakota | 30.3 |
| 43 | Utah | 29.6 |
| 44 | Michigan | 29.5 |
| 45 | Texas | 29.0 |
| 46 | Iowa | 28.8 |
| 47 | Delaware | 28.3 |
| 48 | Maryland | 25.4 |
| 48 | Missouri | 25.4 |
| 50 | Nebraska | 24.6 |
| 51 | Kansas | 22.0 |
Cost to charge an EV at home
The average cost of residential electricity (needed for at-home EV charging) was 16.3 cents per kWh in December 2024 — the latest month with available data.
Residential electricity costs in 2024 were highest in November, at 17.0 cents per kWh. But that figure fell 4.4% to 16.3 cents per kWh in December.
What about in the past — and the future?
- Past: The inflation-adjusted cost of residential electricity has remained stable. The average price jumped from 12.5 cents per kWh in 2014 to 16.5 in 2024. However, the inflation-adjusted price in 2024 was 0.7% lower than in 2014.
- Future: The U.S. Energy Information Administration (EIA) predicts that residential electricity prices will be 16.9 cents per kWh in 2025 and 17.5 in 2026.
Residential electricity rates can vary depending on when you use it. Many companies offer time-of-use (TOU) pricing, meaning electricity rates are lower during off-peak hours — typically late at night — and higher during peak demand times. These variations aren’t considered when discussing residential charging costs. Additionally, the expense of installing home charging stations isn’t factored in.
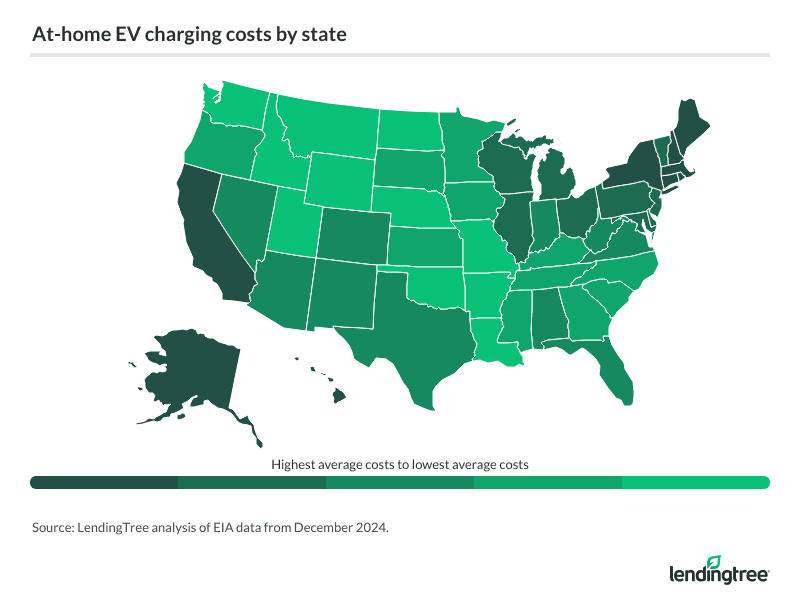
Hawaii (42.3 cents per kWh), Massachusetts (31.2 cents) and California (30.6 cents) were the most expensive states for at-home charging as of December 2024.
States with the highest average at-home EV charging costs
| Rank | State | Avg. cost, cents per kWh |
|---|---|---|
| 1 | Hawaii | 42.3 |
| 2 | Massachusetts | 31.2 |
| 3 | California | 30.6 |
Meanwhile, North Dakota (10.2 cents per kWh), Nebraska (10.8 cents), and Idaho and Utah (both at 11.0 cents) were the least expensive states for it.
Full rankings: States with the highest/lowest average at-home EV charging costs
| Rank | State | Avg. cost, cents per kWh |
|---|---|---|
| 1 | Hawaii | 42.3 |
| 2 | Massachusetts | 31.2 |
| 3 | California | 30.6 |
| 4 | Connecticut | 28.2 |
| 5 | Maine | 26.3 |
| 6 | Rhode Island | 25.3 |
| 7 | New York | 24.4 |
| 8 | New Hampshire | 23.6 |
| 9 | Alaska | 22.4 |
| 10 | Vermont | 22.3 |
| 11 | New Jersey | 19.5 |
| 12 | District of Columbia | 18.8 |
| 13 | Michigan | 18.4 |
| 14 | Maryland | 18.2 |
| 15 | Pennsylvania | 17.6 |
| 16 | Delaware | 16.7 |
| 17 | Wisconsin | 16.3 |
| 18 | Illinois | 16.0 |
| 18 | Ohio | 16.0 |
| 20 | Texas | 15.3 |
| 21 | Arizona | 15.2 |
| 21 | Colorado | 15.2 |
| 23 | Alabama | 14.9 |
| 23 | Nevada | 14.9 |
| 25 | West Virginia | 14.5 |
| 25 | Virginia | 14.5 |
| 27 | Indiana | 14.4 |
| 28 | New Mexico | 14.3 |
| 29 | Florida | 14.2 |
| 30 | Oregon | 14.1 |
| 30 | Minnesota | 14.1 |
| 32 | South Carolina | 13.9 |
| 32 | Kansas | 13.9 |
| 34 | Georgia | 13.5 |
| 34 | North Carolina | 13.5 |
| 36 | Mississippi | 13.4 |
| 37 | Kentucky | 13.3 |
| 38 | Tennessee | 13.0 |
| 39 | Iowa | 12.4 |
| 39 | South Dakota | 12.4 |
| 41 | Montana | 11.9 |
| 42 | Washington | 11.8 |
| 42 | Wyoming | 11.8 |
| 44 | Arkansas | 11.7 |
| 44 | Louisiana | 11.7 |
| 46 | Missouri | 11.6 |
| 47 | Oklahoma | 11.5 |
| 48 | Utah | 11.0 |
| 48 | Idaho | 11.0 |
| 50 | Nebraska | 10.8 |
| 51 | North Dakota | 10.2 |
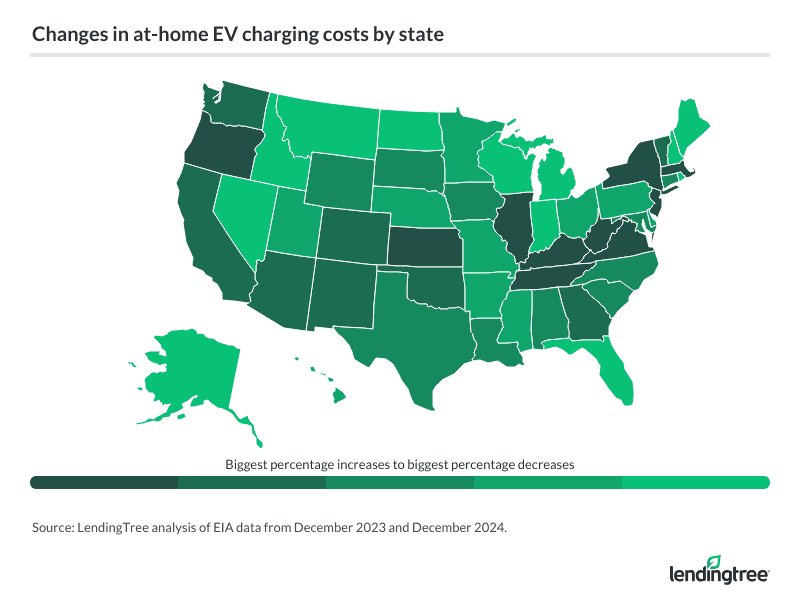
At-home charging costs increase most in Oregon
Between December 2023 and December 2024, residential electricity prices increased the most in Oregon (11.9%), New Jersey (10.8%) and Kansas (9.4%).
States with the biggest percentage increases in residential energy costs
| Rank | State | Avg. cost, cents per kWh, December 2024 | Avg. cost, cents per kWh, December 2023 | % change |
|---|---|---|---|---|
| 1 | Oregon | 14.1 | 12.6 | 11.9% |
| 2 | New Jersey | 19.5 | 17.6 | 10.8% |
| 3 | Kansas | 13.9 | 12.7 | 9.4% |
Meanwhile, the average price of residential electricity fell the most in Rhode Island (18.1%) — the only state with a double-digit decrease. Alaska (7.4%) and Florida (6.6%) followed. Overall, prices rose in 38 states, fell in 12 and remained the same in one.
Full rankings: States with the biggest percentage increases/decreases in residential energy costs
| Rank | State | Avg. cost, cents per kWh, December 2024 | Avg. cost, cents per kWh, December 2023 | % change |
|---|---|---|---|---|
| 1 | Oregon | 14.1 | 12.6 | 11.9% |
| 2 | New Jersey | 19.5 | 17.6 | 10.8% |
| 3 | Kansas | 13.9 | 12.7 | 9.4% |
| 4 | New York | 24.4 | 22.4 | 8.9% |
| 5 | West Virginia | 14.5 | 13.4 | 8.2% |
| 6 | Illinois | 16.0 | 14.8 | 8.1% |
| 6 | Kentucky | 13.3 | 12.3 | 8.1% |
| 8 | Massachusetts | 31.2 | 28.9 | 8.0% |
| 9 | Tennessee | 13.0 | 12.1 | 7.4% |
| 9 | Virginia | 14.5 | 13.5 | 7.4% |
| 11 | Washington | 11.8 | 11.0 | 7.3% |
| 12 | Colorado | 15.2 | 14.2 | 7.0% |
| 13 | New Mexico | 14.3 | 13.4 | 6.7% |
| 14 | Oklahoma | 11.5 | 10.8 | 6.5% |
| 15 | Georgia | 13.5 | 12.7 | 6.3% |
| 16 | Vermont | 22.3 | 21.1 | 5.7% |
| 17 | District of Columbia | 18.8 | 17.8 | 5.6% |
| 17 | Arizona | 15.2 | 14.4 | 5.6% |
| 19 | California | 30.6 | 29.1 | 5.2% |
| 20 | South Dakota | 12.4 | 11.8 | 5.1% |
| 21 | Alabama | 14.9 | 14.2 | 4.9% |
| 22 | Connecticut | 28.2 | 26.9 | 4.8% |
| 22 | Texas | 15.3 | 14.6 | 4.8% |
| 24 | South Carolina | 13.9 | 13.3 | 4.5% |
| 24 | Louisiana | 11.7 | 11.2 | 4.5% |
| 26 | Wyoming | 11.8 | 11.3 | 4.4% |
| 27 | Maryland | 18.2 | 17.5 | 4.0% |
| 28 | North Carolina | 13.5 | 13.0 | 3.8% |
| 29 | Iowa | 12.4 | 12.0 | 3.3% |
| 30 | Nebraska | 10.8 | 10.5 | 2.9% |
| 31 | Missouri | 11.6 | 11.3 | 2.7% |
| 32 | Ohio | 16.0 | 15.6 | 2.6% |
| 33 | Delaware | 16.7 | 16.3 | 2.5% |
| 34 | Mississippi | 13.4 | 13.1 | 2.3% |
| 35 | Hawaii | 42.3 | 41.6 | 1.7% |
| 35 | Arkansas | 11.7 | 11.5 | 1.7% |
| 37 | Utah | 11.0 | 10.9 | 0.9% |
| 38 | Pennsylvania | 17.6 | 17.5 | 0.6% |
| 39 | Minnesota | 14.1 | 14.1 | 0.0% |
| 40 | North Dakota | 10.2 | 10.3 | -1.0% |
| 41 | Indiana | 14.4 | 14.6 | -1.4% |
| 42 | Michigan | 18.4 | 18.7 | -1.6% |
| 43 | Wisconsin | 16.3 | 16.6 | -1.8% |
| 44 | Idaho | 11.0 | 11.5 | -4.3% |
| 45 | Nevada | 14.9 | 15.6 | -4.5% |
| 45 | New Hampshire | 23.6 | 24.7 | -4.5% |
| 47 | Montana | 11.9 | 12.6 | -5.6% |
| 48 | Maine | 26.3 | 28.0 | -6.1% |
| 49 | Florida | 14.2 | 15.2 | -6.6% |
| 50 | Alaska | 22.4 | 24.2 | -7.4% |
| 51 | Rhode Island | 25.3 | 30.9 | -18.1% |
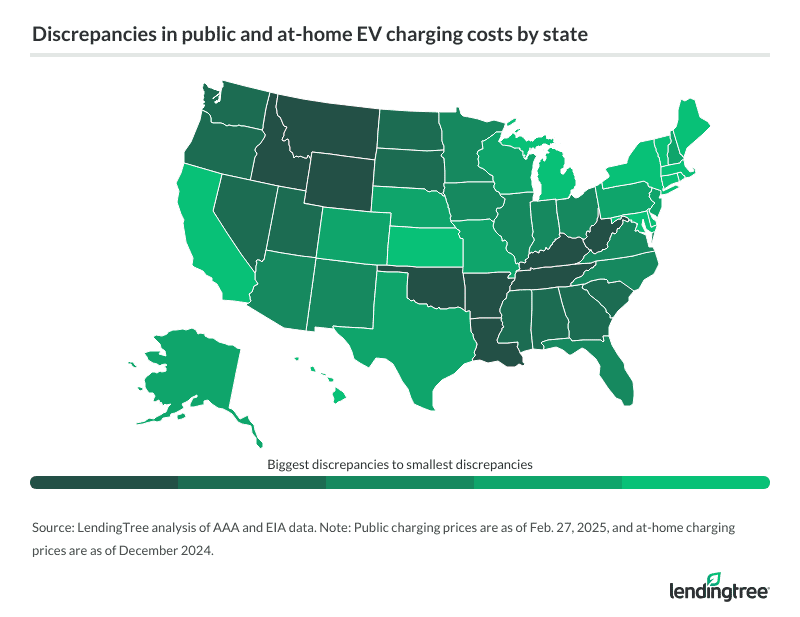
Idaho has biggest discrepancy between public, at-home charging costs
In the U.S., public charging costs more than twice as much as at-home charging — 34.2 cents per kWh at public and commercial charging stations and 16.3 cents at home stations (based on residential electricity costs). That’s an additional 110.3%.
That discrepancy is biggest in Idaho (288.2% more), Montana (280.7%) and Arkansas (261.5%). In total, public charging costs at least double in 35 states.
States with the biggest discrepancies in public and at-home EV charging costs
| Rank | State | Avg. public cost, cents per kWh | Avg. at-home cost, cents per kWh | Difference (cents) | Difference (%) |
|---|---|---|---|---|---|
| 1 | Idaho | 42.7 | 11.0 | 31.7 | 288.2% |
| 2 | Montana | 45.3 | 11.9 | 33.4 | 280.7% |
| 3 | Arkansas | 42.3 | 11.7 | 30.6 | 261.5% |
Conversely, Massachusetts has the smallest cost discrepancy, with public charging costing just 2.9% more than residential electricity. California (15.4%) and Hawaii (31.9%) follow.
Full rankings: States with the biggest/smallest discrepancies in public and at-home EV charging costs
| Rank | State | Avg. public cost, cents per kWh | Avg. at-home cost, cents per kWh | Difference (cents) | Difference (%) |
|---|---|---|---|---|---|
| 1 | Idaho | 42.7 | 11.0 | 31.7 | 288.2% |
| 2 | Montana | 45.3 | 11.9 | 33.4 | 280.7% |
| 3 | Arkansas | 42.3 | 11.7 | 30.6 | 261.5% |
| 4 | Louisiana | 40.2 | 11.7 | 28.5 | 243.6% |
| 5 | Oklahoma | 39.4 | 11.5 | 27.9 | 242.6% |
| 6 | West Virginia | 47.3 | 14.5 | 32.8 | 226.2% |
| 7 | Tennessee | 42.0 | 13.0 | 29.0 | 223.1% |
| 8 | Wyoming | 37.5 | 11.8 | 25.7 | 217.8% |
| 9 | Kentucky | 41.6 | 13.3 | 28.3 | 212.8% |
| 10 | North Dakota | 30.3 | 10.2 | 20.1 | 197.1% |
| 11 | South Carolina | 41.2 | 13.9 | 27.3 | 196.4% |
| 12 | Georgia | 39.5 | 13.5 | 26.0 | 192.6% |
| 13 | Washington | 33.2 | 11.8 | 21.4 | 181.4% |
| 14 | Mississippi | 37.6 | 13.4 | 24.2 | 180.6% |
| 15 | Utah | 29.6 | 11.0 | 18.6 | 169.1% |
| 16 | Alabama | 39.1 | 14.9 | 24.2 | 162.4% |
| 17 | South Dakota | 31.7 | 12.4 | 19.3 | 155.6% |
| 18 | Oregon | 36.0 | 14.1 | 21.9 | 155.3% |
| 19 | Nevada | 37.8 | 14.9 | 22.9 | 153.7% |
| 21 | New Mexico | 36.1 | 14.3 | 21.8 | 152.4% |
| 20 | Indiana | 36.5 | 14.4 | 22.1 | 153.5% |
| 22 | Minnesota | 35.5 | 14.1 | 21.4 | 151.8% |
| 23 | North Carolina | 33.7 | 13.5 | 20.2 | 149.6% |
| 24 | Florida | 35.4 | 14.2 | 21.2 | 149.3% |
| 25 | Virginia | 34.5 | 14.5 | 20.0 | 137.9% |
| 26 | Illinois | 37.2 | 16.0 | 21.2 | 132.5% |
| 27 | Iowa | 28.8 | 12.4 | 16.4 | 132.3% |
| 28 | Arizona | 35.2 | 15.2 | 20.0 | 131.6% |
| 29 | Ohio | 36.9 | 16.0 | 20.9 | 130.6% |
| 30 | Nebraska | 24.6 | 10.8 | 13.8 | 127.8% |
| 31 | Missouri | 25.4 | 11.6 | 13.8 | 119.0% |
| 32 | Pennsylvania | 37.9 | 17.6 | 20.3 | 115.3% |
| 32 | Wisconsin | 35.1 | 16.3 | 18.8 | 115.3% |
| 34 | Colorado | 31.8 | 15.2 | 16.6 | 109.2% |
| 35 | New Jersey | 39.4 | 19.5 | 19.9 | 102.1% |
| 36 | District of Columbia | 35.9 | 18.8 | 17.1 | 91.0% |
| 37 | Texas | 29.0 | 15.3 | 13.7 | 89.5% |
| 38 | Alaska | 41.2 | 22.4 | 18.8 | 83.9% |
| 39 | New Hampshire | 42.0 | 23.6 | 18.4 | 78.0% |
| 40 | Delaware | 28.3 | 16.7 | 11.6 | 69.5% |
| 41 | Michigan | 29.5 | 18.4 | 11.1 | 60.3% |
| 42 | Kansas | 22.0 | 13.9 | 8.1 | 58.3% |
| 43 | Rhode Island | 38.7 | 25.3 | 13.4 | 53.0% |
| 44 | Vermont | 32.3 | 22.3 | 10.0 | 44.8% |
| 45 | Maine | 37.6 | 26.3 | 11.3 | 43.0% |
| 46 | New York | 34.6 | 24.4 | 10.2 | 41.8% |
| 47 | Maryland | 25.4 | 18.2 | 7.2 | 39.6% |
| 48 | Connecticut | 37.6 | 28.2 | 9.4 | 33.3% |
| 49 | Hawaii | 55.8 | 42.3 | 13.5 | 31.9% |
| 50 | California | 35.3 | 30.6 | 4.7 | 15.4% |
| 51 | Massachusetts | 32.1 | 31.2 | 0.9 | 2.9% |
- Hybrid vs. plug-in hybrid vs. electric vehicles: How they compare
- 2025 EV tax credit: What you need to know
- How to find cheap electric car insurance
- How much does a Tesla cost?
- How to plan a road trip in your new electric vehicle
- Electric vehicle registrations continually rise more than 20%
- Colorado has the best electric vehicle infrastructure
- Best and worst states to own an electric vehicle
Methodology
LendingTree researchers analyzed AAA public and commercial electric vehicle (EV) charging data. This includes the national and state daily average costs per kilowatt-hour (per kWh) for all types of commercial and public charging — Level 1, Level 2 and Level 3/DC fast charging. These prices are as of Feb. 27, 2025.
We also analyzed U.S. Energy Information Administration (EIA) data on residential electricity costs per kWh. The latest available data is from December 2024.
Get auto loan offers from up to 5 lenders in minutes
Recommended Articles