Division Over Subtraction: Republicans, Democrats Split on Mass Federal Firings (and the States Most Impacted)


Since the Feb. 11 executive order to reduce the federal workforce, headline after headline has chronicled the drastic shift in the District of Columbia and beyond.
Americans are greatly divided on the impact of these mass federal firings and layoffs. While 71% are concerned about the economic impact, a higher rate of Democrats (89%) feel this way than Republicans (59%), according to a LendingTree survey of 2,000 Americans.
In addition to gathering consumer sentiment, we explored the states most and least impacted by mass federal firings, where federal workers’ earnings are most and least affected, and more.
- 16% of Americans personally know a federal worker who’s been laid off or fired since President Donald Trump’s January inauguration.
- 20% personally know a federal worker who they’re concerned will be laid off or fired.
- 56% agree with the layoffs or firings if they make the government more efficient, with a significant split among Republicans (79%) and Democrats (36%).
- 71% are concerned about the economic impact of the layoffs and firings, with Republicans (59%) less worried than Democrats (89%).
- The states most impacted by mass firings are the District of Columbia (20.85% of workers are employed by the federal government) and Maryland (5.21%).
- The percentage of the workforce employed by the federal government is the same as in 2015 — 1.46% — but that figure has increased in the past two years.
- The states where mass firings most impact workers’ earnings are also D.C. ($144,529 average salary among federal workers) and Maryland ($135,943).
Personal impact of mass federal firings
We asked 2,000 respondents whether they personally know any federal workers, whether they know a federal worker who’s been laid off or fired since Trump’s inauguration (and what their relationship is if so), and whether there are future concerns.
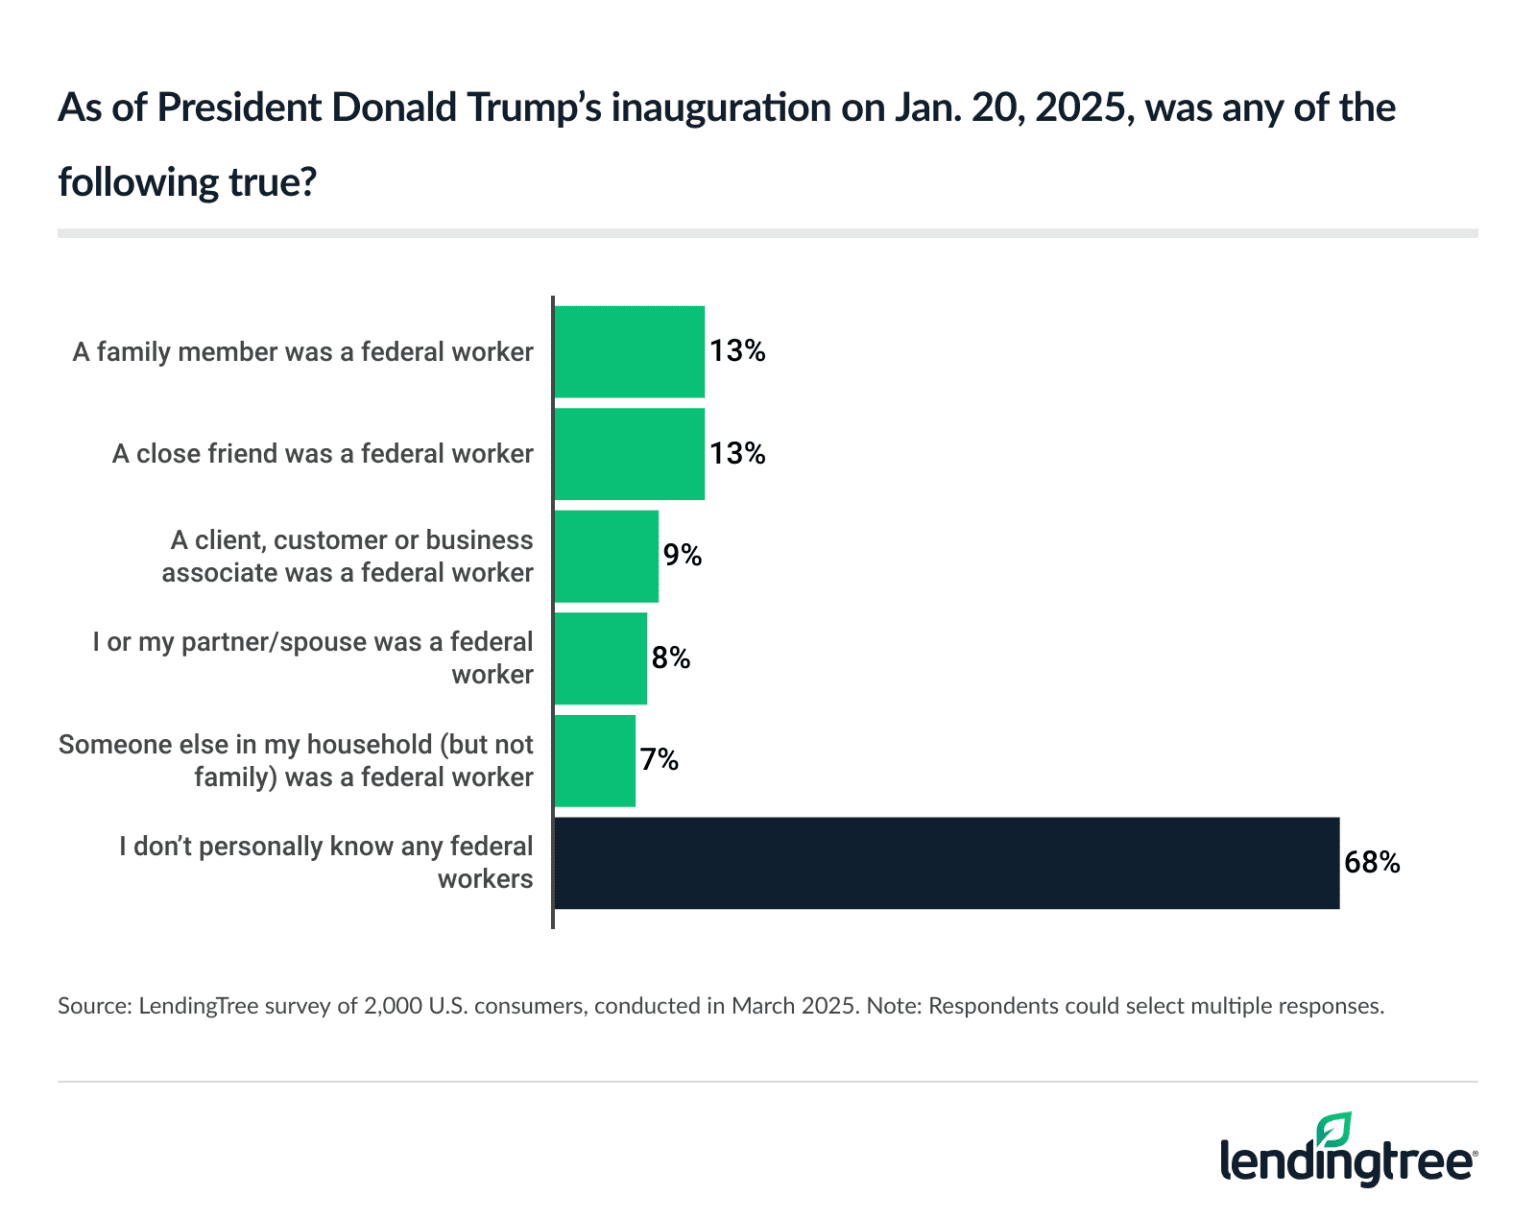
What was your relationship with the federal worker who was laid off or fired? (Respondents could select multiple relationships)
- Family member (45%)
- They or their partner/spouse (35%)
- Close friend (26%)
- Someone else in their household but not family (25%)
- Client, customer or business associate (9%)
Do you personally know a federal worker who you’re concerned will be laid off or fired?
- Yes (20%)
- No (80%)
Firings: Efficiency, economic impact, spending habits
We also wanted to gather respondents’ feelings on the mass federal firings and layoffs, from whether they agree with them if they make the government more efficient to concern over the economic impact to whether they’ll impact their spending habits.
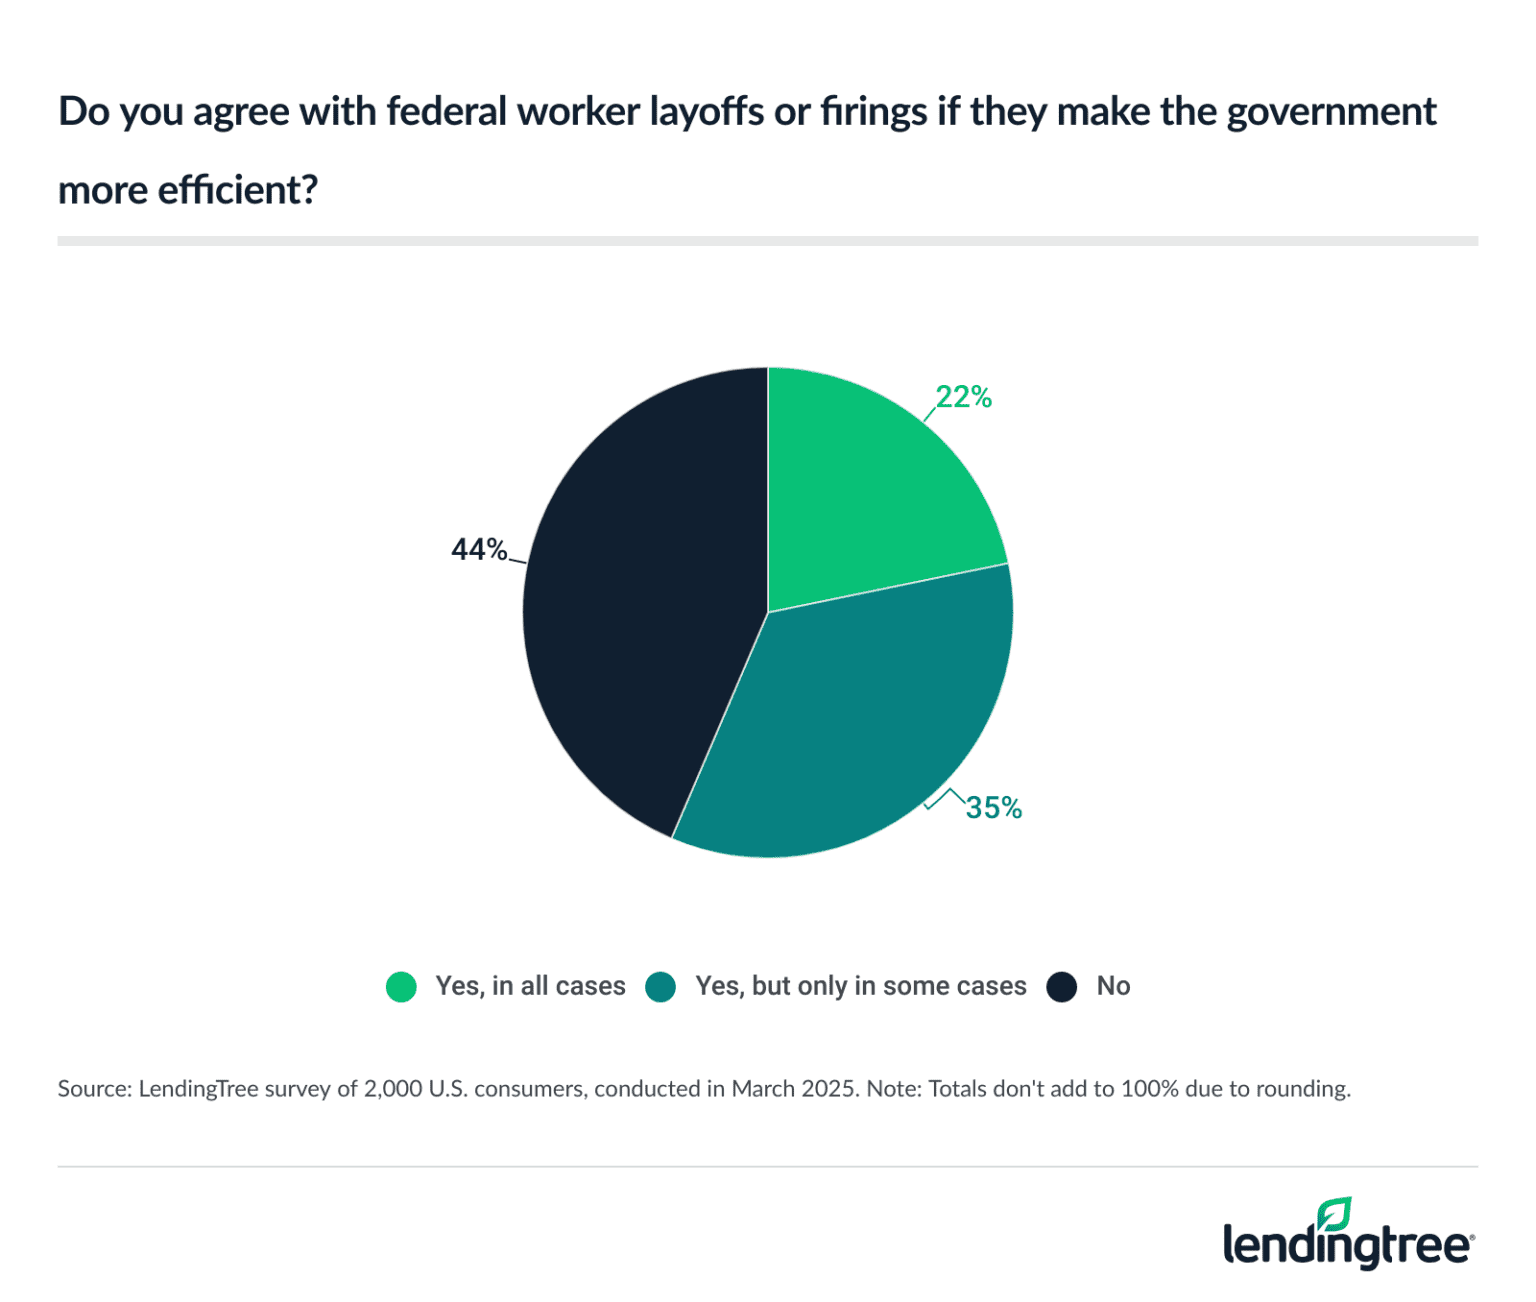
- Political breakdown (in all cases): 38% of Republicans, 11% of Democrats, 15% of independents
- Political breakdown (only in some cases): 42% of Republicans, 25% of Democrats, 35% of independents
- Political breakdown (combined): 79% of Republicans, 36% of Democrats, 50% of independents
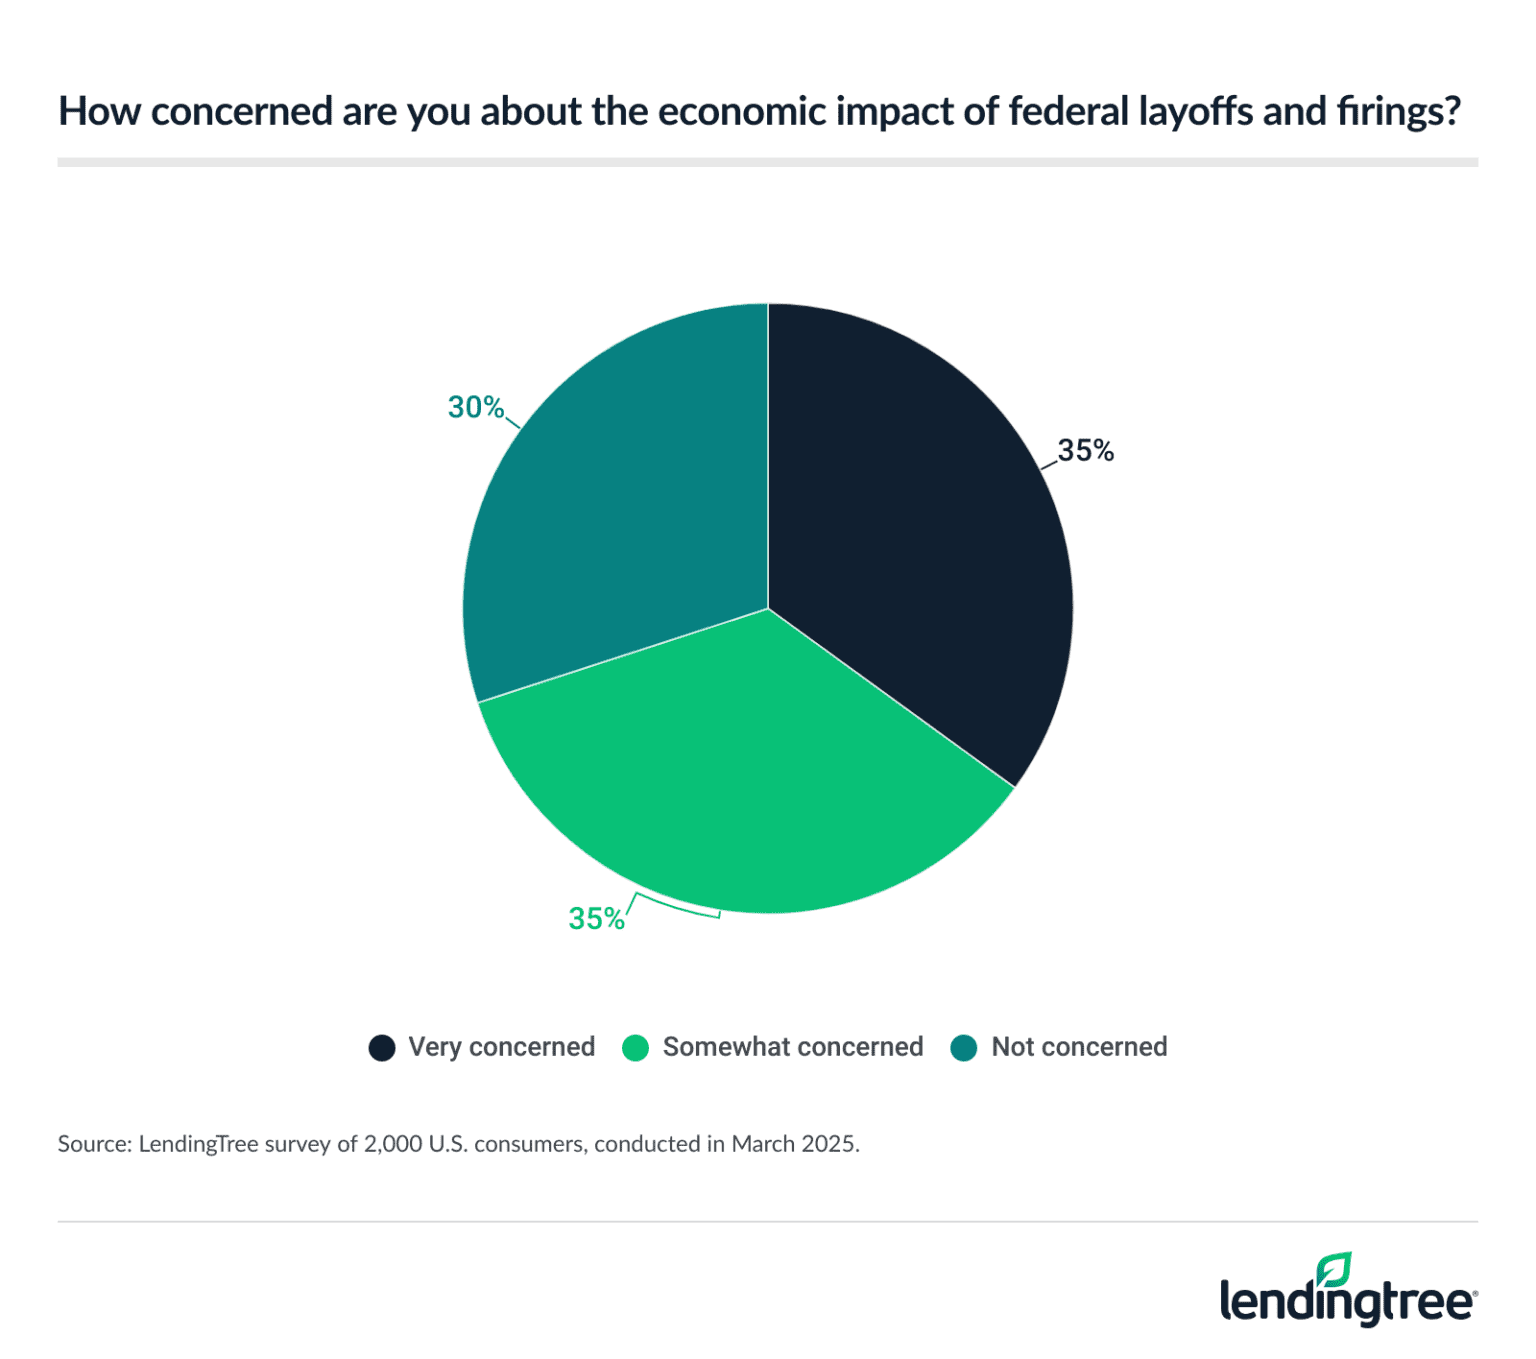
- Political breakdown (very or somewhat concerned): 59% of Republicans, 89% of Democrats, 67% of independents
Do you or your partner expect to adjust spending habits due to concerns about federal layoffs or firings?
- Yes, I expect to spend less (29%)
- Yes, I expect to spend more (11%)
- No (60%)
- Political breakdown (spend less): 28% of Republicans, 34% of Democrats, 27% of independents
- Political breakdown (spend more): 12% of Republicans, 12% of Democrats, 8% of independents
- Political breakdown (no): 61% of Republicans, 54% of Democrats, 65% of independents
States most/least impacted by mass federal firings
Percentage of workforce employed by federal government (by state)
| Rank | State | # of federal civilian workers | % of workforce employed by federal gov’t |
|---|---|---|---|
| 1 | District of Columbia | 162,489 | 20.85% |
| 2 | Maryland | 144,497 | 5.21% |
| 3 | Hawaii | 24,804 | 3.85% |
| 4 | Virginia | 147,358 | 3.45% |
| 5 | Alaska | 11,658 | 3.41% |
| 6 | New Mexico | 22,695 | 2.54% |
| 7 | West Virginia | 17,301 | 2.40% |
| 8 | Oklahoma | 42,212 | 2.34% |
| 9 | Wyoming | 6,832 | 2.30% |
| 10 | Montana | 11,353 | 2.12% |
| 11 | Maine | 12,717 | 1.94% |
| 12 | South Dakota | 8,940 | 1.91% |
| 12 | Utah | 33,961 | 1.91% |
| 14 | Alabama | 41,319 | 1.86% |
| 15 | Rhode Island | 8,598 | 1.67% |
| 16 | Mississippi | 19,690 | 1.65% |
| 17 | Georgia | 81,366 | 1.63% |
| 18 | Washington | 58,508 | 1.59% |
| 19 | Colorado | 41,167 | 1.37% |
| 20 | North Dakota | 5,736 | 1.27% |
| 21 | Idaho | 10,993 | 1.24% |
| 22 | Kansas | 17,824 | 1.21% |
| 22 | Missouri | 37,220 | 1.21% |
| 24 | Kentucky | 23,449 | 1.14% |
| 25 | Pennsylvania | 66,656 | 1.07% |
| 25 | Vermont | 3,368 | 1.07% |
| 27 | Arizona | 34,460 | 1.05% |
| 27 | Oregon | 20,952 | 1.05% |
| 29 | South Carolina | 24,863 | 1.04% |
| 30 | Arkansas | 14,269 | 1.03% |
| 30 | North Carolina | 51,900 | 1.03% |
| 32 | Louisiana | 19,486 | 0.99% |
| 32 | Ohio | 56,068 | 0.99% |
| 34 | Nebraska | 10,412 | 0.97% |
| 34 | Tennessee | 32,574 | 0.97% |
| 36 | Florida | 95,167 | 0.95% |
| 37 | Texas | 130,686 | 0.91% |
| 38 | Nevada | 13,967 | 0.88% |
| 39 | California | 150,679 | 0.83% |
| 40 | Delaware | 3,998 | 0.82% |
| 41 | Indiana | 24,499 | 0.74% |
| 42 | Illinois | 45,213 | 0.73% |
| 43 | New Hampshire | 5,208 | 0.72% |
| 44 | Massachusetts | 25,698 | 0.69% |
| 45 | Michigan | 29,822 | 0.66% |
| 46 | Iowa | 9,930 | 0.62% |
| 47 | Minnesota | 18,183 | 0.60% |
| 48 | Wisconsin | 17,946 | 0.59% |
| 49 | New York | 54,092 | 0.55% |
| 50 | New Jersey | 22,684 | 0.52% |
| 51 | Connecticut | 7,304 | 0.43% |
Percentage of workforce employed by federal gov’t unchanged
Percentage of workforce employed by federal government (nationally)
| Year | # of federal civilian workers | % of workforce employed by federal gov’t | YoY increase/decrease in # |
|---|---|---|---|
| 2015 | 2,071,716 | 1.46% | N/A |
| 2016 | 2,097,038 | 1.45% | 1.22% |
| 2017 | 2,087,747 | 1.42% | -0.44% |
| 2018 | 2,100,802 | 1.41% | 0.63% |
| 2019 | 2,132,812 | 1.41% | 1.52% |
| 2020 | 2,181,106 | 1.53% | 2.26% |
| 2021 | 2,191,011 | 1.50% | 0.45% |
| 2022 | 2,180,296 | 1.43% | -0.49% |
| 2023 | 2,261,016 | 1.45% | 3.70% |
| 2024 | 2,313,216 | 1.46% | 2.31% |
States where workers’ earnings are most/least impacted
Average salaries for federal civilian workers
| Rank | State | Avg. salary |
|---|---|---|
| 1 | District of Columbia | $144,529 |
| 2 | Maryland | $135,943 |
| 3 | New Jersey | $122,416 |
| 4 | Virginia | $120,315 |
| 5 | Rhode Island | $114,372 |
| 6 | Massachusetts | $114,099 |
| 7 | New Hampshire | $113,371 |
| 8 | Connecticut | $113,319 |
| 9 | California | $113,239 |
| 10 | Colorado | $109,719 |
| 11 | Illinois | $108,069 |
| 12 | Michigan | $106,597 |
| 13 | Ohio | $105,753 |
| 14 | Alabama | $105,678 |
| 15 | Vermont | $105,633 |
| 16 | New York | $104,690 |
| 17 | Minnesota | $103,873 |
| 18 | Delaware | $103,656 |
| 19 | Florida | $102,226 |
| 20 | Washington | $101,787 |
| 21 | Texas | $99,998 |
| 22 | West Virginia | $99,870 |
| 23 | Hawaii | $99,738 |
| 24 | Alaska | $99,686 |
| 25 | Pennsylvania | $98,871 |
| 26 | Nevada | $98,707 |
| 27 | Georgia | $98,415 |
| 28 | North Carolina | $98,292 |
| 29 | Wisconsin | $96,895 |
| 30 | Oregon | $96,700 |
| 31 | South Carolina | $96,494 |
| 32 | Arizona | $96,248 |
| 33 | Indiana | $96,107 |
| 34 | Nebraska | $95,445 |
| 35 | Iowa | $94,700 |
| 36 | Louisiana | $94,597 |
| 37 | New Mexico | $94,088 |
| 38 | Kansas | $94,021 |
| 39 | Arkansas | $92,368 |
| 40 | Maine | $92,299 |
| 41 | Tennessee | $91,185 |
| 42 | Missouri | $90,196 |
| 43 | Oklahoma | $89,358 |
| 44 | Mississippi | $89,338 |
| 45 | Kentucky | $88,043 |
| 46 | North Dakota | $87,935 |
| 47 | Utah | $85,761 |
| 48 | South Dakota | $84,991 |
| 49 | Idaho | $84,820 |
| 50 | Montana | $84,397 |
| 51 | Wyoming | $83,876 |
Where federal workers have been in place the longest
Average length of service among federal civilian employees
| Rank | State | Avg. length (years) |
|---|---|---|
| 1 | District of Columbia | 14.0 |
| 2 | Maryland | 13.9 |
| 3 | New Jersey | 13.1 |
| 4 | Alabama | 12.5 |
| 5 | Virginia | 12.2 |
| 5 | New Hampshire | 12.2 |
| 7 | Massachusetts | 11.9 |
| 8 | Pennsylvania | 11.8 |
| 8 | Georgia | 11.8 |
| 8 | New Mexico | 11.8 |
| 11 | Illinois | 11.6 |
| 11 | Texas | 11.6 |
| 13 | Ohio | 11.5 |
| 13 | West Virginia | 11.5 |
| 13 | Louisiana | 11.5 |
| 16 | California | 11.4 |
| 16 | New York | 11.4 |
| 16 | Hawaii | 11.4 |
| 19 | Connecticut | 11.3 |
| 19 | Colorado | 11.3 |
| 19 | Washington | 11.3 |
| 19 | Indiana | 11.3 |
| 19 | Oklahoma | 11.3 |
| 24 | Rhode Island | 11.2 |
| 24 | Missouri | 11.2 |
| 26 | Florida | 11.1 |
| 26 | Mississippi | 11.1 |
| 26 | Kentucky | 11.1 |
| 29 | South Carolina | 11.0 |
| 30 | Michigan | 10.9 |
| 30 | Delaware | 10.9 |
| 30 | Arizona | 10.9 |
| 30 | Nebraska | 10.9 |
| 30 | Kansas | 10.9 |
| 30 | Arkansas | 10.9 |
| 36 | Alaska | 10.7 |
| 36 | Utah | 10.7 |
| 36 | Montana | 10.7 |
| 39 | Minnesota | 10.6 |
| 39 | North Carolina | 10.6 |
| 39 | Oregon | 10.6 |
| 39 | South Dakota | 10.6 |
| 43 | Vermont | 10.4 |
| 43 | North Dakota | 10.4 |
| 45 | Iowa | 10.3 |
| 45 | Tennessee | 10.3 |
| 47 | Idaho | 10.2 |
| 48 | Wisconsin | 10.0 |
| 48 | Maine | 10.0 |
| 50 | Nevada | 9.7 |
| 50 | Wyoming | 9.7 |
Methodology
LendingTree commissioned QuestionPro to conduct an online survey of 2,000 U.S. consumers ages 18 to 79 from March 4 to 6, 2025. The survey was administered using a nonprobability-based sample, and quotas were used to ensure the sample base represented the overall population. Researchers reviewed all responses for quality control.
We defined generations as the following ages in 2025:
- Generation Z: 18 to 28
- Millennial: 29 to 44
- Generation X: 45 to 60
- Baby boomer: 61 to 79
Additionally, LendingTree researchers analyzed U.S. Office of Personnel Management (OPM) and U.S. Bureau of Labor Statistics (BLS) data to determine the:
- Percentage of the workforce employed by the federal government (by state)
- Percentage of the workforce employed by the federal government (nationally)
- Average salaries for federal civilian workers
- Average length of service among federal civilian employees
Compare business loan offers