About 1 in 3 Americans in Biggest Metros Opened or Closed Credit Card in Past Year — Who Did It Most and Where They Live


More than 1 in every 3 people in America’s 100 biggest metros opened a credit card in the past year, according to a new LendingTree analysis, and Gen Xers led the way.
Meanwhile, 30% of people in those same metros closed a credit card in the past year, with baby boomers the most likely to do so.
LendingTree reviewed more than a quarter of a million anonymized credit reports to find trends in opening and closing credit cards across the country. We looked not just at who was doing it over the past 12 months, but also where they live, how old they are and the cards’ credit limits.
Here’s what we found.
- 37.0% of Americans with credit reports in the 100 largest metros have opened at least one new credit card in the past 12 months. The average credit limit for these newly opened cards was $6,147. Notably, 39.5% of Gen Xers opened at least one new card during this period — the highest percentage among the generations.
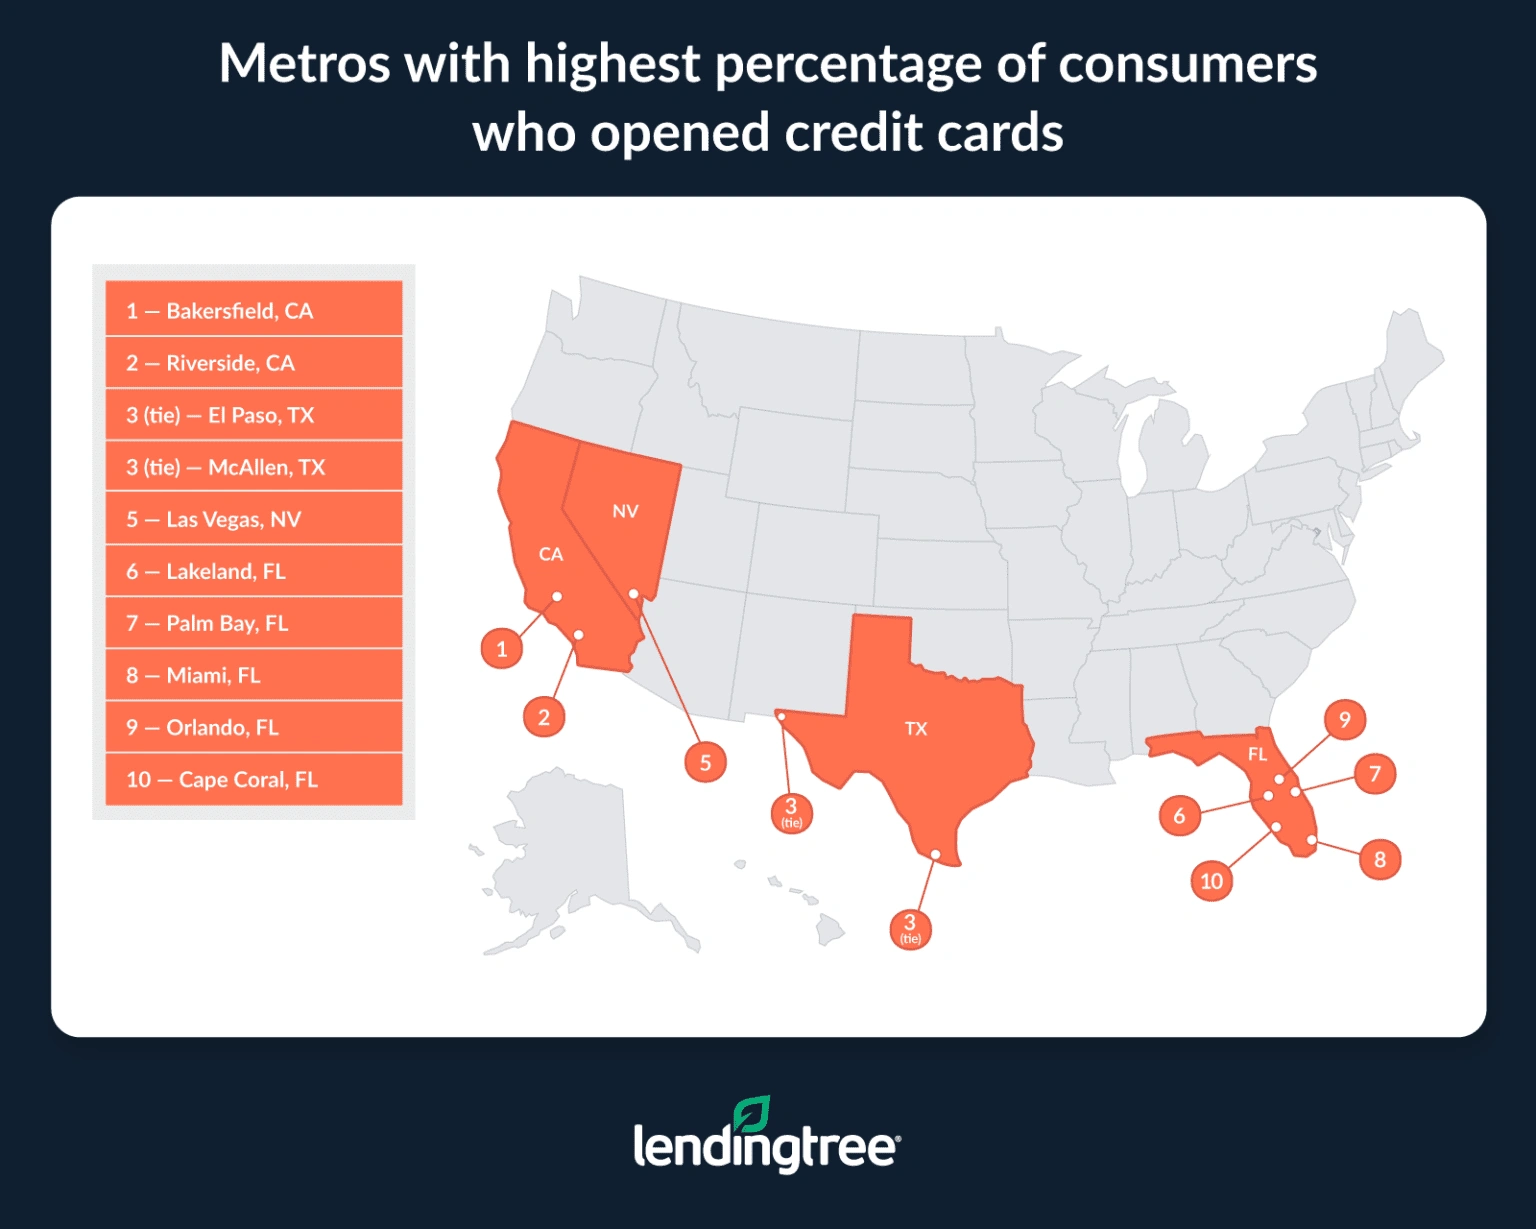
- Two California metros’ residents were most likely to open a credit card, but Florida and Texas dominated the rest of the top 10. Bakersfield and Riverside in California led the list, with 43.9% and 42.4% of residents opening a credit card in the past year. Seven of the remaining metros in the top 10 were in Texas or Florida, including five from the Sunshine State.
- In the past year, 30.2% of consumers in those same 100 metros closed at least one credit card. The average credit limit on closed cards was $4,078 — 33.7% lower than the average limit on newly opened cards. One in 3 (33.3%) baby boomers closed at least one credit card in the past year, narrowly making it the generation with the highest closure rate.
- Consumers in Deltona, Fla., and El Paso, Texas, were the most likely to close a card. These metros topped our list with closure rates of 36.1%, closely followed by Stockton, Calif., at 35.8%. Metros where residents were least likely to close credit cards were Jackson, Miss. (23.8%), Seattle (25.5%) and Portland, Ore. (26.2%).
- Baby boomers were the only age group who closed more credit cards than they opened. For every 100 Americans in those large metros who closed a credit card, 122 opened a new one. Gen Zers opened 185 for every 100 they closed. However, boomers closed more accounts than they opened, with 98 openings for every 100 closings.
More than 1 in 3 in biggest metros opened card in past year
There are a million possible reasons for opening a credit card. Maybe you’re doing a big project and need to finance it. Maybe you’re starting a small business. Maybe you’re a rewards junkie and can’t stop chasing miles and points. Or maybe you need it to stretch your budget a bit to make ends meet.
Whatever their reason, millions of people — 37.0% of Americans with credit reports in the 100 largest metros — have opened at least one new credit card in the past 12 months.
Gen Xers ages 44 to 59 in these metros were the most likely age group to have done so (39.5%), versus:
- 38.0% of millennials ages 28 to 43
- 37.8% of Gen Zers ages 18 to 27
- 32.7% of baby boomers ages 60 to 78
The average credit limit across the 100 metros for these newly opened cards was $6,147. Again, there was a significant generation gap in credit limits, with older Americans having far higher average limits than younger ones.
The average credit limit for a card opened by a baby boomer was $8,073, more than double the average for Gen Z-opened cards ($3,572). Meanwhile, Gen Xers and millennials averaged $6,602 and $5,337, respectively.
Credit card openings by generation in 100 largest metros
| Generation | % who opened card in past year | Avg. credit limit on new cards |
|---|---|---|
| Baby boomers | 32.7% | $8,073 |
| Gen Xers | 39.5% | $6,602 |
| Millennials | 38.0% | $5,337 |
| Gen Zers | 37.8% | $3,572 |
Those differences make sense, given that older Americans tend to have higher credit scores and incomes than their younger counterparts. Those two factors play a major role in determining the credit limit you’re granted.
2 California metros top new-cards list, but Texas and Florida metros dominate, too
In each of the nation’s 100 most populous metros, at least 30.0% of residents opened a credit card in the past year, according to our analysis.
However, there were significant differences among the big metros. For example, 43.9% of Bakersfield, Calif., residents opened a card, while just 30.2% of Grand Rapids, Mich., residents did the same.
Riverside, Calif. — about 165 miles south of Bakersfield — was second on the list at 42.4%. However, the rest of the top 10 was dominated by two other huge states — Texas and Florida. Seven of the remaining metros in the top 10 were from those two states, with Las Vegas (fifth) being the only exception.
Joining Grand Rapids at the bottom were Tulsa, Okla., Spokane, Wash., and Jackson, Miss., all of whom had 31.9% or fewer of their residents open a card in the past year.
Full rankings: Credit card openings in 100 largest metros
| Rank | Metro | % who opened card in past year | Avg. credit limit on new cards |
|---|---|---|---|
| 1 | Bakersfield, CA | 43.9% | $3,682 |
| 2 | Riverside, CA | 42.4% | $4,928 |
| 3 | El Paso, TX | 42.3% | $3,864 |
| 3 | McAllen, TX | 42.3% | $3,509 |
| 5 | Las Vegas, NV | 41.7% | $5,278 |
| 6 | Lakeland, FL | 41.2% | $4,398 |
| 7 | Palm Bay, FL | 41.1% | $5,281 |
| 8 | Miami, FL | 41.0% | $6,035 |
| 9 | Orlando, FL | 40.5% | $5,615 |
| 10 | Cape Coral, FL | 40.3% | $5,667 |
| 11 | Syracuse, NY | 40.1% | $5,096 |
| 12 | Los Angeles, CA | 39.5% | $6,544 |
| 13 | San Antonio, TX | 39.4% | $4,714 |
| 14 | Allentown, PA | 39.3% | $5,358 |
| 15 | Columbia, SC | 39.2% | $5,168 |
| 16 | North Port, FL | 39.1% | $7,203 |
| 17 | Deltona, FL | 39.0% | $5,951 |
| 17 | Tampa, FL | 39.0% | $6,197 |
| 19 | Buffalo, NY | 38.9% | $5,202 |
| 19 | Poughkeepsie, NY | 38.9% | $5,548 |
| 21 | Fresno, CA | 38.6% | $5,069 |
| 22 | Houston, TX | 38.5% | $5,492 |
| 23 | Pittsburgh, PA | 38.4% | $6,209 |
| 23 | Provo, UT | 38.4% | $7,291 |
| 25 | Hartford, CT | 38.3% | $6,056 |
| 25 | Winston-Salem, NC | 38.3% | $4,950 |
| 27 | Augusta, GA | 38.2% | $4,649 |
| 28 | Jacksonville, FL | 38.1% | $5,485 |
| 29 | New York, NY | 37.9% | $6,451 |
| 29 | Toledo, OH | 37.9% | $4,281 |
| 31 | Cleveland, OH | 37.8% | $5,913 |
| 31 | Providence, RI | 37.8% | $5,631 |
| 31 | Rochester, NY | 37.8% | $5,983 |
| 34 | Charlotte, NC | 37.6% | $5,690 |
| 34 | Sacramento, CA | 37.6% | $6,827 |
| 34 | Worcester, MA | 37.6% | $5,381 |
| 37 | Akron, OH | 37.5% | $5,824 |
| 38 | Phoenix, AZ | 37.3% | $6,154 |
| 39 | Oxnard, CA | 37.2% | $6,754 |
| 39 | San Jose, CA | 37.2% | $10,665 |
| 41 | Dallas, TX | 37.0% | $6,252 |
| 41 | Scranton, PA | 37.0% | $3,546 |
| 43 | Albuquerque, NM | 36.9% | $5,648 |
| 43 | Atlanta, GA | 36.9% | $5,743 |
| 43 | Boise, ID | 36.9% | $6,272 |
| 43 | Dayton, OH | 36.9% | $5,224 |
| 43 | Stockton, CA | 36.9% | $5,611 |
| 43 | Tucson, AZ | 36.9% | $6,189 |
| 49 | Chicago, IL | 36.8% | $6,193 |
| 49 | Memphis, TN | 36.8% | $4,427 |
| 51 | Denver, CO | 36.7% | $7,060 |
| 52 | Austin, TX | 36.6% | $7,364 |
| 52 | Greenville, SC | 36.6% | $4,734 |
| 54 | Detroit, MI | 36.5% | $5,583 |
| 55 | Philadelphia, PA | 36.4% | $6,004 |
| 55 | Wichita, KS | 36.4% | $5,042 |
| 57 | Albany, NY | 36.2% | $5,166 |
| 57 | Greensboro, NC | 36.2% | $4,871 |
| 57 | Omaha, NE | 36.2% | $6,692 |
| 60 | Knoxville, TN | 36.1% | $5,890 |
| 61 | New Haven, CT | 35.9% | $5,417 |
| 61 | San Diego, CA | 35.9% | $7,213 |
| 63 | Harrisburg, PA | 35.8% | $5,132 |
| 63 | Little Rock, AR | 35.8% | $4,713 |
| 65 | Richmond, VA | 35.7% | $5,785 |
| 66 | Indianapolis, IN | 35.6% | $5,998 |
| 67 | Colorado Springs, CO | 35.5% | $6,780 |
| 68 | Cincinnati, OH | 35.4% | $5,963 |
| 69 | New Orleans, LA | 35.1% | $5,037 |
| 69 | Raleigh, NC | 35.1% | $6,431 |
| 69 | San Francisco, CA | 35.1% | $9,387 |
| 69 | Springfield, MA | 35.1% | $4,883 |
| 69 | Virginia Beach, VA | 35.1% | $4,899 |
| 74 | Bridgeport, CT | 35.0% | $7,915 |
| 74 | Nashville, TN | 35.0% | $6,182 |
| 76 | Baltimore, MD | 34.9% | $6,158 |
| 76 | Baton Rouge, LA | 34.9% | $4,204 |
| 78 | Charleston, SC | 34.6% | $5,429 |
| 79 | St. Louis, MO | 34.5% | $5,641 |
| 80 | Columbus, OH | 34.4% | $6,261 |
| 81 | Oklahoma City, OK | 34.3% | $4,719 |
| 82 | Boston, MA | 34.2% | $7,202 |
| 82 | Salt Lake City, UT | 34.2% | $6,366 |
| 82 | Honolulu, HI | 34.2% | $7,123 |
| 85 | Birmingham, AL | 34.1% | $4,806 |
| 86 | Des Moines, IA | 34.0% | $5,896 |
| 86 | Washington, DC | 34.0% | $7,596 |
| 88 | Ogden, UT | 33.7% | $6,333 |
| 89 | Portland, OR | 33.5% | $7,263 |
| 90 | Minneapolis, MN | 33.1% | $7,340 |
| 91 | Madison, WI | 32.9% | $7,009 |
| 92 | Milwaukee, WI | 32.8% | $5,808 |
| 93 | Durham, NC | 32.7% | $8,286 |
| 94 | Louisville, KY | 32.5% | $5,599 |
| 94 | Seattle, WA | 32.5% | $8,876 |
| 96 | Kansas City, MO | 32.4% | $6,320 |
| 97 | Jackson, MS | 31.9% | $3,916 |
| 98 | Spokane, WA | 31.8% | $5,326 |
| 99 | Tulsa, OK | 31.5% | $4,512 |
| 100 | Grand Rapids, MI | 30.2% | $5,578 |
3 in 10 in biggest metros closed card in past year
Our analysis also showed that millions of Americans in the largest metros — 30.2%, to be exact — closed a credit card in the past year.
The older you are, the more likely you are to have done so. One in 3 boomers (33.3%) had closed a card in the past year, making them the most likely age group to have closed one. Gen Xers weren’t far behind at 33.0%, while millennials and Gen Zers lagged at 28.6% and 20.5%, respectively.
Overall, the average credit limit regardless of generation on these closed cards ($4,078) was smaller than the average for opened cards ($6,147). However, as we saw with the opened cards, there was a significant generational gap in the limits we saw. Boomers’ closed cards averaged $5,427 — more than three times Gen Z’s average of $1,766.
Credit card closings by generation in 100 largest metros
| Generation | % who closed card in past year | Avg. credit limit on closed cards |
|---|---|---|
| Baby boomers | 33.3% | $5,427 |
| Gen Xers | 33.0% | $4,308 |
| Millennials | 28.6% | $3,171 |
| Gen Zers | 20.5% | $1,766 |
Our analysis showed that for every 100 people in those largest metros who closed a credit card, 122 opened a new one.
Boomers were the only age group that closed more credit cards than they opened — 98 opened a card for every 100 that closed one. Meanwhile, Gen Zers opened 185 for every 100 they closed.
Florida, Texas, California also dominate list of metros with most credit card closures
The two California metros with the highest percentage of residents opening a card also made the top 10 for closing credit cards. Riverside (34.0%) and Bakersfield (33.7%) had the eighth- and 10th-highest percentage of residents closing a card. However, Deltona, Fla., and El Paso, Texas, shared the top spot at 36.1%.
Metros in the nation’s four most populous states — California, Texas, Florida and New York — took all of the top 10 spots on this list. Florida had the most with four.
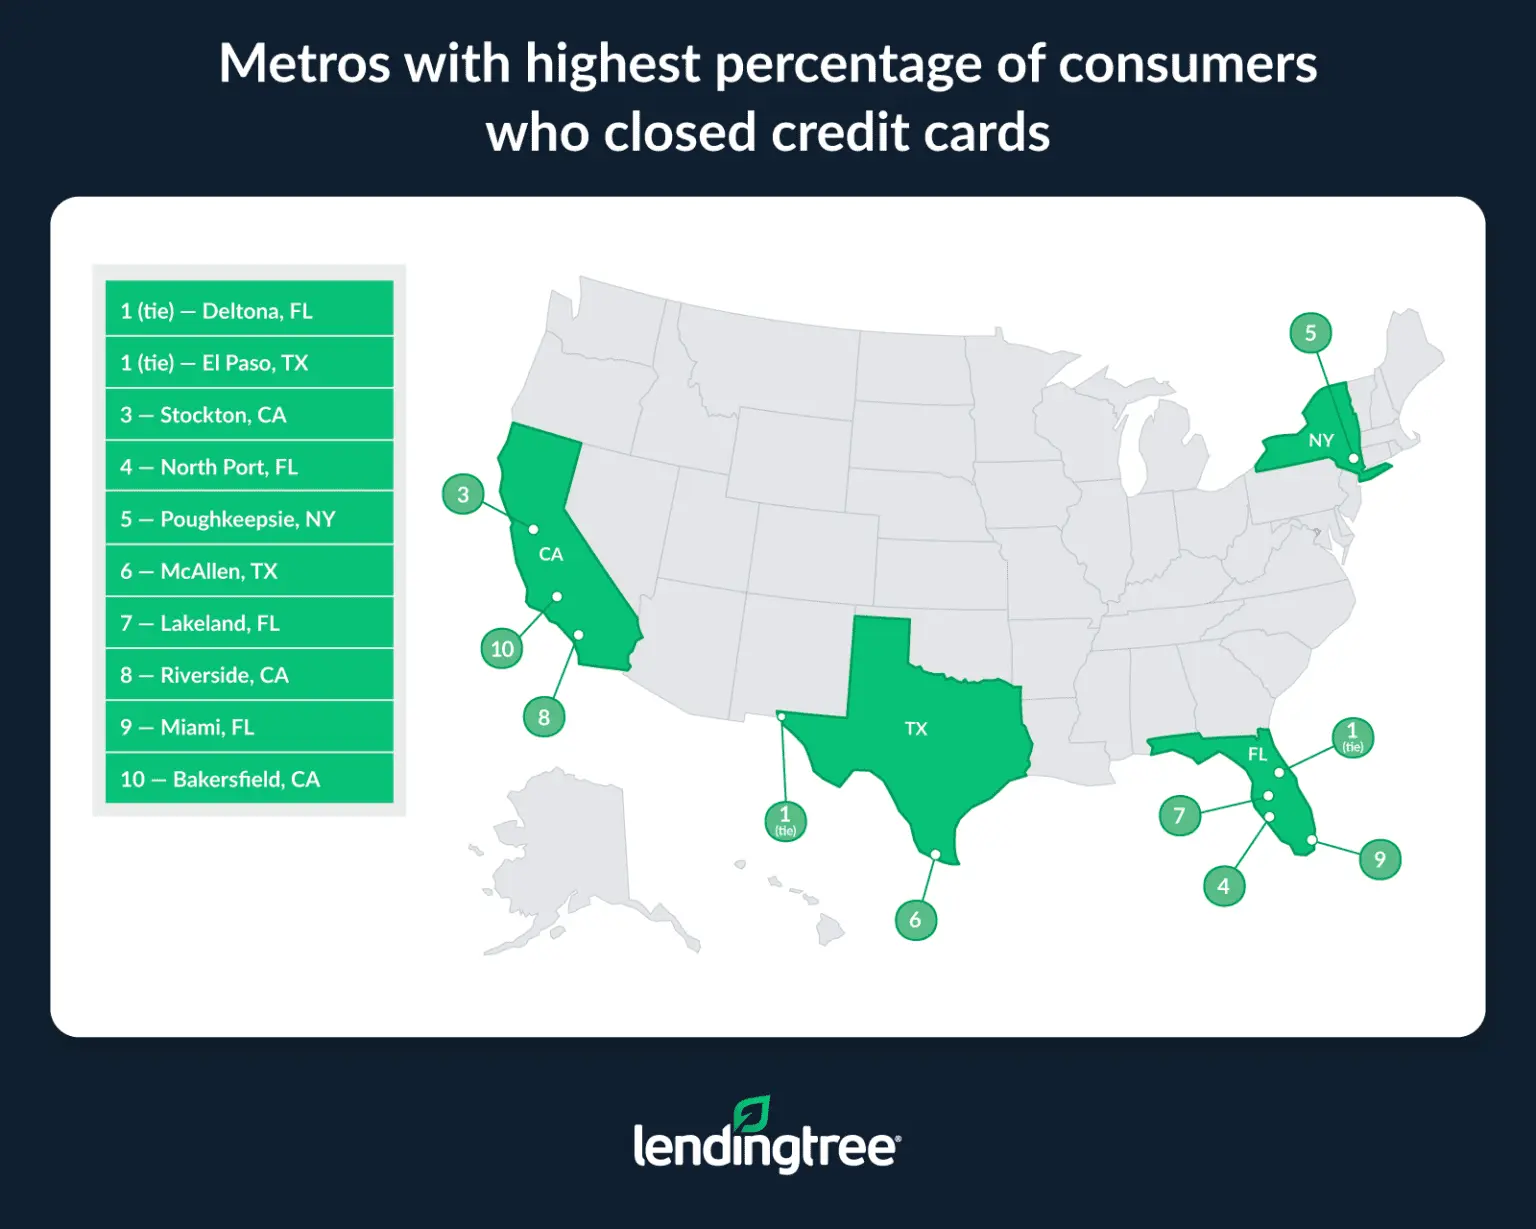
Jackson, Miss., residents were least likely to close credit cards. Fewer than 1 in 4 residents there (23.8%) had closed a card. Seattle (25.5%), Portland, Ore. (26.2%), and Provo, Utah (26.4%), weren’t far behind.
Full rankings: Credit card closings in 100 largest metros
| Rank | Metro | % who closed card in past year | Avg. credit limit on closed cards |
|---|---|---|---|
| 1 | Deltona, FL | 36.1% | $3,584 |
| 1 | El Paso, TX | 36.1% | $3,018 |
| 3 | Stockton, CA | 35.8% | $3,015 |
| 4 | North Port, FL | 35.6% | $4,868 |
| 5 | Poughkeepsie, NY | 35.1% | $3,672 |
| 6 | McAllen, TX | 34.2% | $2,656 |
| 7 | Lakeland, FL | 34.1% | $2,696 |
| 8 | Riverside, CA | 34.0% | $3,330 |
| 9 | Miami, FL | 33.8% | $4,027 |
| 10 | Bakersfield, CA | 33.7% | $2,847 |
| 11 | New Orleans, LA | 33.5% | $3,134 |
| 12 | Baton Rouge, LA | 33.4% | $3,026 |
| 12 | Hartford, CT | 33.4% | $4,426 |
| 12 | Palm Bay, FL | 33.4% | $4,424 |
| 12 | Scranton, PA | 33.4% | $2,591 |
| 16 | Nashville, TN | 33.2% | $3,790 |
| 17 | Buffalo, NY | 33.0% | $3,678 |
| 18 | Providence, RI | 32.8% | $3,767 |
| 19 | Allentown, PA | 32.7% | $3,676 |
| 19 | Tampa, FL | 32.7% | $3,707 |
| 21 | Pittsburgh, PA | 32.5% | $3,534 |
| 22 | Rochester, NY | 32.4% | $4,353 |
| 22 | Sacramento, CA | 32.4% | $4,423 |
| 24 | Cleveland, OH | 32.2% | $3,734 |
| 24 | Dayton, OH | 32.2% | $4,314 |
| 24 | Worcester, MA | 32.2% | $4,018 |
| 27 | New Haven, CT | 32.1% | $3,228 |
| 28 | Springfield, MA | 31.8% | $3,762 |
| 29 | New York, NY | 31.5% | $4,030 |
| 29 | Toledo, OH | 31.5% | $3,056 |
| 31 | Cape Coral, FL | 31.3% | $4,079 |
| 32 | Akron, OH | 31.2% | $4,668 |
| 32 | Memphis, TN | 31.2% | $3,097 |
| 34 | Albany, NY | 31.1% | $3,792 |
| 34 | Augusta, GA | 31.1% | $3,034 |
| 34 | Virginia Beach, VA | 31.1% | $3,532 |
| 37 | Greensboro, NC | 31.0% | $3,042 |
| 37 | San Antonio, TX | 31.0% | $3,454 |
| 39 | Las Vegas, NV | 30.9% | $3,511 |
| 40 | Dallas, TX | 30.6% | $4,093 |
| 41 | Los Angeles, CA | 30.5% | $4,345 |
| 41 | St. Louis, MO | 30.5% | $4,380 |
| 43 | Charlotte, NC | 30.4% | $4,136 |
| 43 | Fresno, CA | 30.4% | $3,053 |
| 43 | Houston, TX | 30.4% | $3,548 |
| 43 | Orlando, FL | 30.4% | $3,737 |
| 47 | Jacksonville, FL | 30.3% | $3,735 |
| 47 | Ogden, UT | 30.3% | $4,643 |
| 47 | Richmond, VA | 30.3% | $3,885 |
| 50 | Philadelphia, PA | 30.2% | $4,188 |
| 51 | Columbia, SC | 30.0% | $3,361 |
| 51 | Tucson, AZ | 30.0% | $4,010 |
| 53 | Knoxville, TN | 29.9% | $4,238 |
| 53 | Louisville, KY | 29.9% | $3,698 |
| 55 | Omaha, NE | 29.8% | $4,023 |
| 56 | Chicago, IL | 29.7% | $4,061 |
| 56 | Detroit, MI | 29.7% | $3,911 |
| 56 | Wichita, KS | 29.7% | $3,268 |
| 56 | Winston-Salem, NC | 29.7% | $3,116 |
| 60 | Indianapolis, IN | 29.6% | $4,199 |
| 61 | Bridgeport, CT | 29.5% | $5,371 |
| 61 | Cincinnati, OH | 29.5% | $3,973 |
| 63 | Oklahoma City, OK | 29.4% | $3,945 |
| 64 | Syracuse, NY | 29.3% | $3,223 |
| 65 | Colorado Springs, CO | 29.2% | $4,689 |
| 66 | Greenville, SC | 29.1% | $3,612 |
| 66 | Raleigh, NC | 29.1% | $4,582 |
| 68 | Charleston, SC | 28.8% | $4,118 |
| 69 | Baltimore, MD | 28.7% | $4,497 |
| 69 | Phoenix, AZ | 28.7% | $4,131 |
| 71 | Des Moines, IA | 28.6% | $5,038 |
| 72 | San Diego, CA | 28.5% | $5,143 |
| 72 | Tulsa, OK | 28.5% | $2,852 |
| 74 | Little Rock, AR | 28.4% | $3,178 |
| 75 | Atlanta, GA | 28.3% | $4,001 |
| 75 | Spokane, WA | 28.3% | $2,843 |
| 77 | Boise, ID | 28.1% | $4,648 |
| 77 | Minneapolis, MN | 28.1% | $5,001 |
| 77 | San Francisco, CA | 28.1% | $5,683 |
| 80 | Grand Rapids, MI | 28.0% | $3,010 |
| 81 | Boston, MA | 27.9% | $4,644 |
| 81 | Salt Lake City, UT | 27.9% | $3,962 |
| 83 | Birmingham, AL | 27.8% | $3,320 |
| 83 | Denver, CO | 27.8% | $4,962 |
| 83 | Milwaukee, WI | 27.8% | $3,996 |
| 86 | Columbus, OH | 27.7% | $4,034 |
| 87 | Austin, TX | 27.5% | $5,263 |
| 87 | Washington, DC | 27.5% | $4,947 |
| 89 | Durham, NC | 27.3% | $4,747 |
| 89 | Madison, WI | 27.3% | $5,431 |
| 89 | Honolulu, HI | 27.3% | $4,663 |
| 92 | Harrisburg, PA | 27.2% | $2,882 |
| 93 | Albuquerque, NM | 27.1% | $4,151 |
| 93 | Oxnard, CA | 27.1% | $4,964 |
| 95 | Kansas City, MO | 27.0% | $4,578 |
| 96 | San Jose, CA | 26.8% | $5,694 |
| 97 | Provo, UT | 26.4% | $4,113 |
| 98 | Portland, OR | 26.2% | $4,827 |
| 99 | Seattle, WA | 25.5% | $4,969 |
| 100 | Jackson, MS | 23.8% | $2,511 |
What to think about when opening, closing credit cards
Opening and closing credit cards isn’t something that should be done haphazardly. Either move can significantly impact your personal financial situation, so tread lightly.
When it comes to opening new credit cards:
- Shop around. There can be huge differences among different cards from different financial institutions. If you don’t take the time to compare and contrast, you’re likely doing yourself a disservice.
- Know thyself. Are you comfortable managing another credit card? Does this new card help you work toward your financial goals, whatever those might be? If it’s a rewards card, will you have to take on debt to meet the minimum spend requirements for the sign-up bonus? Does the card give you rewards for what you spend on the most? Are you likely to fully take advantage of the card’s rewards and other perks? There are plenty more questions, but answering them honestly and thoughtfully will help you make the best, most informed decision.
- Don’t apply for too much credit too often. Whether you’re chasing rewards or trying to keep your head above water, applying for credit cards regularly can be tempting. After all, the right credit card, used wisely, can make a significant difference to your budget. However, getting too many cards too often can damage your credit and make you look desperate to lenders. What “too often” means can be debated, but a good rule of thumb would be that applying for a couple of cards a year is likely just fine, while applying for a couple of cards every month may be overdoing it.
- Consider getting a higher limit instead. A 2024 LendingTree report showed that 84% of people who asked for a higher credit limit on a credit card in the past year got one. That’s a huge number, indicating it isn’t just people with 800 credit scores and long track records who get their way. It’s also regular people who need the help. Remember, however, that your card issuer may do a hard pull on your credit when considering this request.
- Big purchase ahead? It might be best to wait. If you’re getting a mortgage, auto loan or some other big, expensive loan in the next three to six months, it makes sense to be cautious when applying for other types of credit. That’s because credit movement is hard to predict. You don’t know what that new credit card or personal loan is going to mean for your credit. A shift of even five to 10 points in either direction can, for some, be the difference between one credit tier and another, and different credit tiers mean different interest rates for loans. That’s a big deal because a fraction of a percentage point change in interest rates can mean a difference of thousands of dollars with big loans.
When it comes to closing a credit card:
- Your best move is generally not to close it, with one big exception. Closing a credit card can hurt your credit score, so it isn’t something to be done lightly or often. Generally speaking, you’re better off throwing a card in a desk and forgetting about it instead of canceling it. However, a big exception to this rule is if the card has an annual fee. It isn’t worth paying that annual fee regularly just to protect your credit. In that case, cancel the card and make this key move to minimize the damage.
- Increasing the credit limit on another card can ease the hit to your credit caused by closing a card. Typically, the biggest reason why closing a card hurts your credit score is that it increases your credit utilization rate — how much debt you have compared to your available credit. Say you owe $2,000 and have $10,000 in available credit for a utilization rate of 20%. That’s great. However, if closing a card means that you now have just $5,000 in available credit, your rate is now an unacceptably high 40%, which will hurt your credit score. You can avoid this problem by bumping up the credit limit on one of your other cards by the same amount that was available on the now-closed card. Again, the issuer may do a hard pull on your credit when approving the bump, but the short-term ding from that inquiry should pale in comparison to the positive impact of the bump itself.
- Unless the card is by far your oldest, don’t worry too much about your length of history. The truth is that, assuming it has a good history, the closed card will stay on your credit report for the next 10 years. That means it’ll be a long time before you have to worry about that card hurting the length of the history on your credit report. Plus, by the time it falls off your report, another card or two might have 10 more years of history behind them, meaning you’ll likely end up with a long history either way.
- Keep the card active while minimizing the hassle. Instead of cutting up that card, put a small, recurring charge — like a Netflix or Spotify subscription — on it each month and set up automatic payments to cover the bill. That way, the card stays in use, gets paid off every month and sticks around to help you build a positive credit history. Again, this move doesn’t make sense if you’re paying an annual fee on the card, but beyond that, it can be a good, no-muss-no-fuss alternative to closing the card.
Methodology
To determine the percentage of consumers who’ve opened at least one credit card or closed one in the past 12 months, LendingTree researchers analyzed a representative sample of 272,000 anonymized credit reports from Oct. 1 through Dec. 31, 2024, in the 100 most populous U.S. metros.
Researchers used the U.S. Census Bureau 2022 American Community Survey with five-year estimates to identify the 100 largest metros.
Analysts then divided the number of consumers who opened at least one credit card or closed one in that period by the total number of consumers with a credit report. The study considered individual and joint accounts, with joint accounts counting for half to avoid duplication.
We defined generations as the following ages in 2024:
- Generation Z: 18 to 27
- Millennial: 28 to 43
- Generation X: 44 to 59
- Baby boomer: 60 to 78