US Gas Prices Decrease By As Much As 15% — See Where Your State Stacks Up


- The average U.S. gas price on Jan. 15, 2026, was $2.84 per gallon — down 7.9% from $3.09 one year earlier.
- The highest average monthly gas price per gallon in 2025 was $3.17 in September and April, while the lowest was $2.89 in December.
- The average gas price per gallon in 2025 was $3.10, down 6.3% from $3.30 in 2024 and 12.0% from $3.52 in 2023.
- The highest average gas prices are in Hawaii ($4.41 per gallon), California ($4.21) and Washington ($3.80).
- Oklahoma has the lowest average gas price ($2.32 per gallon), ahead of Texas ($2.42) and Kansas, Louisiana and Mississippi (tied at $2.43).
- Average gas prices only increased between Jan. 15, 2025, and Jan. 15, 2026, in Alaska (5.2%). They decreased the least in Washington (2.6%) and Hawaii (2.9%).
- Average gas prices decreased the most between Jan. 15, 2025, and Jan. 15, 2026, in Wyoming (15.0%), Utah (13.2%) and Iowa (13.1%).
- By metro, average gas prices jumped the most in Alaska: Juneau (11.9%), Anchorage (5.6%) and Fairbanks (3.5%).
- By metro, average gas prices decreased the most in Moorhead, Minn. (21.9%), Cheyenne, Wyo. (20.8%), and Fargo-Moorhead, N.D. (20.4%).
Average monthly gas prices are down $2.04 per gallon from their peak in June 2022, according to a LendingTree analysis.
Meanwhile, average daily gas prices are down 7.9% year over year as of Jan. 15. At the state level, prices decreased by as much as 15.0% in Wyoming and increased by as much as 5.2% in Alaska.
We examined the largest fluctuations in gas prices between Jan. 15, 2025, and Jan. 15, 2026. Along with identifying which states and metros saw the biggest changes, we’ll explain how you can use credit card rewards to earn cash back at the pump.
Average gas prices decreased 7.9% nationwide — here’s how they fluctuated
On Jan. 15, 2026, the average U.S. gas price was $2.84 per gallon. That’s down 7.9% from $3.09 on Jan. 15, 2025. In December 2025, the national average dipped below $3.00 for the first time since May 2021.
The average gas price per gallon in 2025 was $3.10, down from $3.30 in 2024. In 2025, the average gas price was lowest in December at $2.89 per gallon and highest in September and April at $3.17.
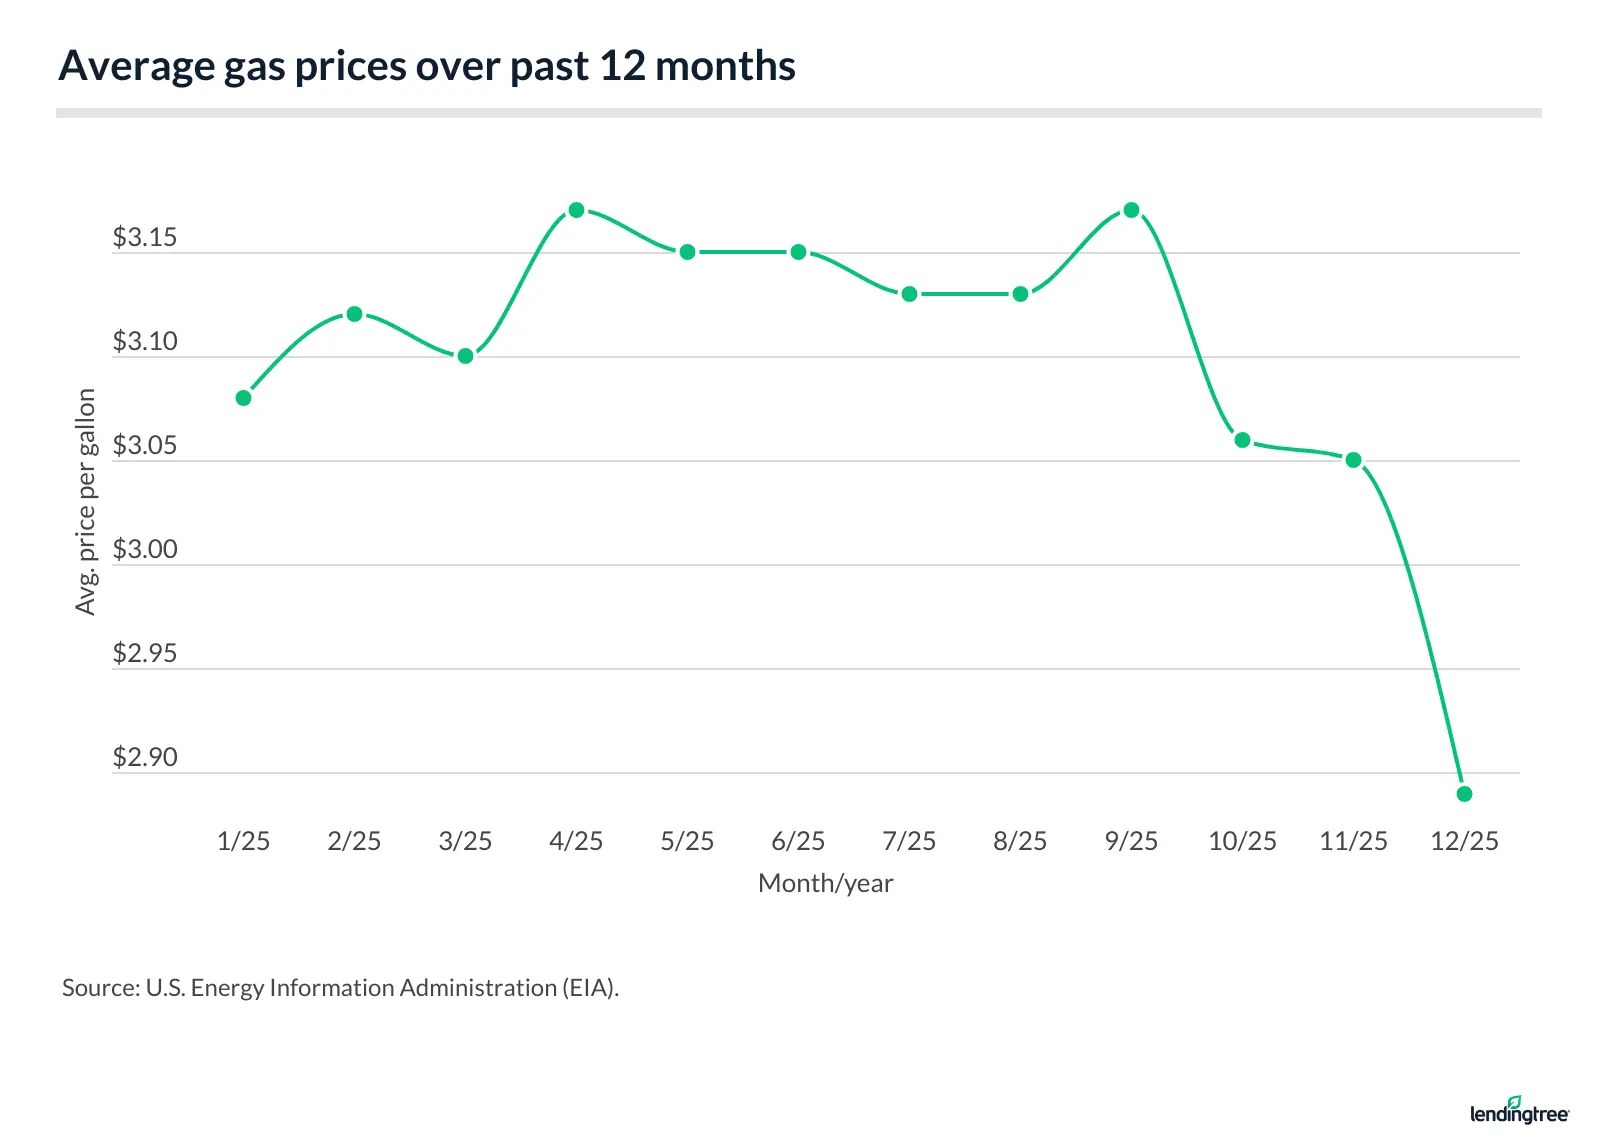
Average gas prices over past 12 months
| Month | Avg. price per gallon |
|---|---|
| December 2025 | $2.89 |
| November 2025 | $3.05 |
| October 2025 | $3.06 |
| September 2025 | $3.17 |
| August 2025 | $3.13 |
| July 2025 | $3.13 |
| June 2025 | $3.15 |
| May 2025 | $3.15 |
| April 2025 | $3.17 |
| March 2025 | $3.10 |
| February 2025 | $3.12 |
| January 2025 | $3.08 |
It’s worth noting that gas prices have decreased in 2024 and 2025 compared to their 2022 highs. To put it into perspective, six of the 10 months with the highest average gas prices, dating back to 1992, occurred in 2022 — including the top five. Notably, the only other months where average gas prices reached over $4.00 a gallon were June and July 2008, when demand was high but global oil production was low.
Highest gas prices (historical)
| Rank | Month | Avg. price per gallon |
|---|---|---|
| 1 | June 2022 | $4.93 |
| 2 | July 2022 | $4.56 |
| 3 | May 2022 | $4.44 |
| 4 | March 2022 | $4.22 |
| 5 | April 2022 | $4.11 |
| 6 | July 2008 | $4.06 |
| 7 | June 2008 | $4.05 |
| 8 | August 2022 | $3.98 |
| 9 | May 2011 | $3.91 |
| 10 | April 2012 | $3.90 |
Still, 2022 wasn’t the worst year for gas prices. After adjusting for inflation, 2012 had the highest average gas price at $5.07 per gallon. Before adjusting for inflation, it was $3.62 per gallon.
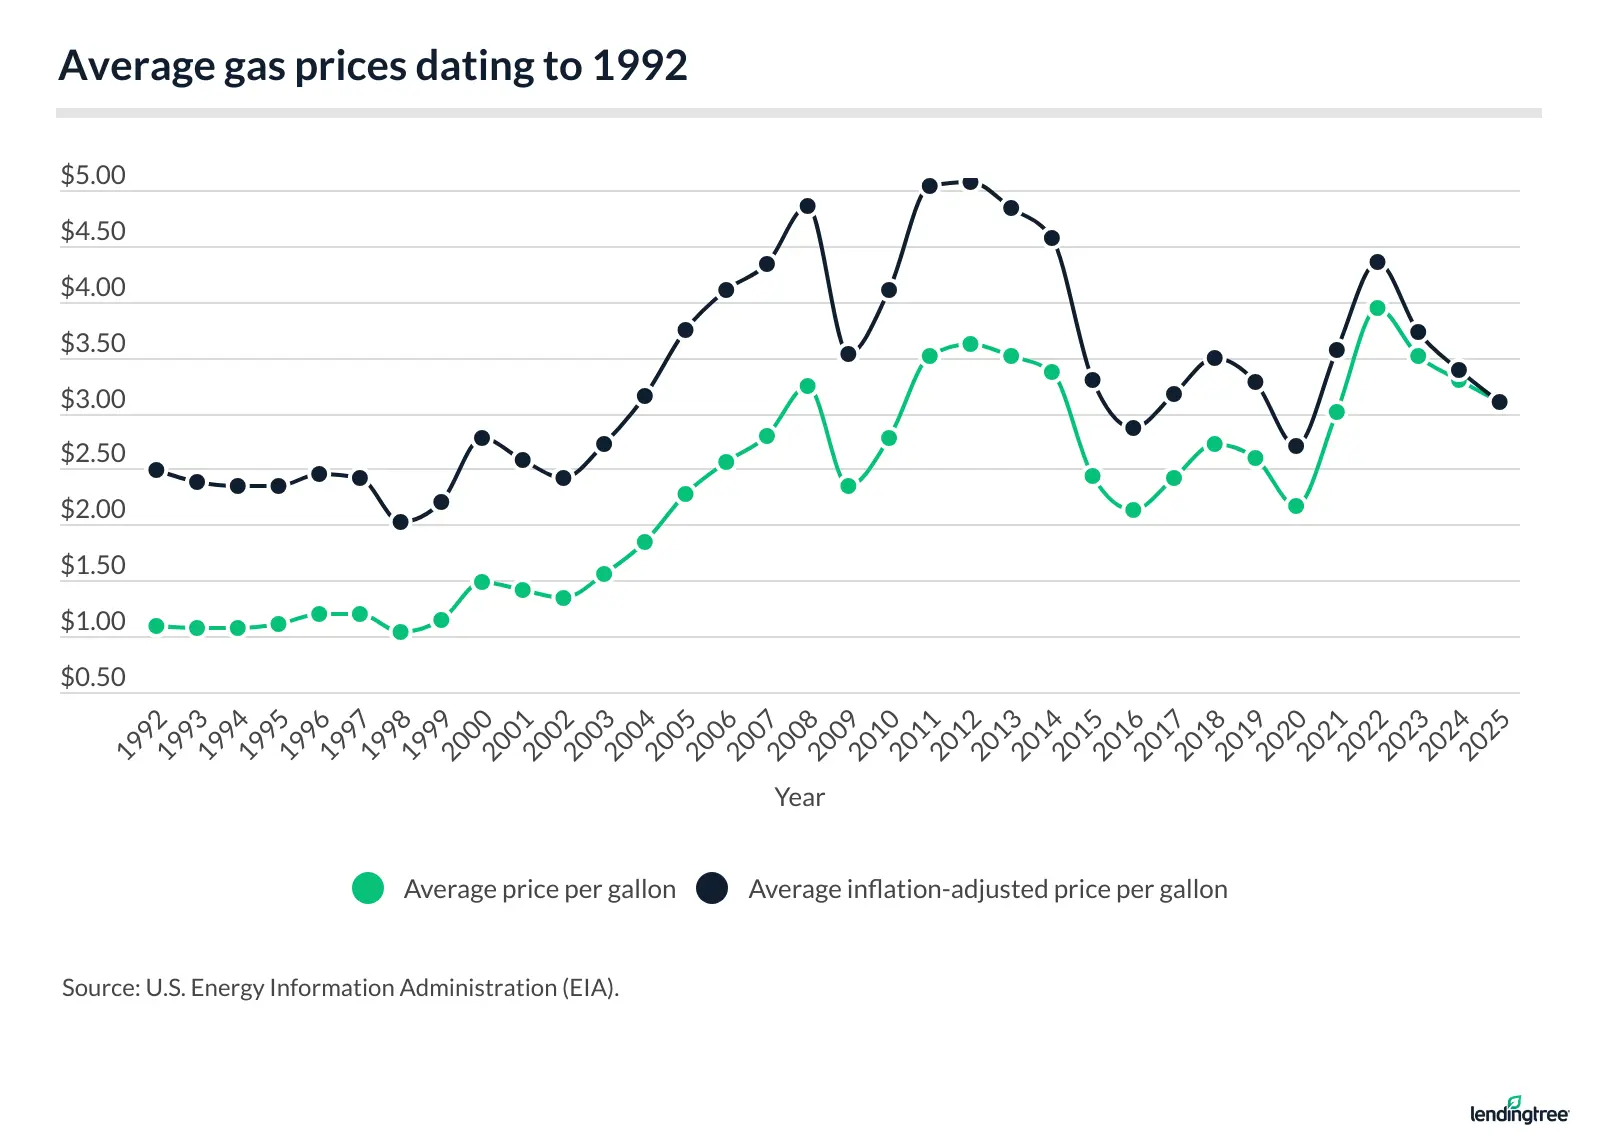
Avg. gas prices dating to 1992
| Year | Avg. price per gallon | Avg. inflation-adjusted price per gallon |
|---|---|---|
| 2025 | $3.10 | $3.10 |
| 2024 | $3.30 | $3.39 |
| 2023 | $3.52 | $3.72 |
| 2022 | $3.95 | $4.35 |
| 2021 | $3.01 | $3.57 |
| 2020 | $2.17 | $2.70 |
| 2019 | $2.60 | $3.28 |
| 2018 | $2.72 | $3.49 |
| 2017 | $2.42 | $3.17 |
| 2016 | $2.14 | $2.87 |
| 2015 | $2.43 | $3.30 |
| 2014 | $3.36 | $4.57 |
| 2013 | $3.51 | $4.84 |
| 2012 | $3.62 | $5.07 |
| 2011 | $3.52 | $5.04 |
| 2010 | $2.78 | $4.11 |
| 2009 | $2.35 | $3.53 |
| 2008 | $3.25 | $4.85 |
| 2007 | $2.80 | $4.34 |
| 2006 | $2.57 | $4.11 |
| 2005 | $2.27 | $3.74 |
| 2004 | $1.85 | $3.16 |
| 2003 | $1.56 | $2.73 |
| 2002 | $1.35 | $2.41 |
| 2001 | $1.42 | $2.58 |
| 2000 | $1.48 | $2.77 |
| 1999 | $1.14 | $2.20 |
| 1998 | $1.03 | $2.03 |
| 1997 | $1.20 | $2.41 |
| 1996 | $1.20 | $2.46 |
| 1995 | $1.11 | $2.35 |
| 1994 | $1.08 | $2.34 |
| 1993 | $1.07 | $2.38 |
| 1992 | $1.09 | $2.49 |
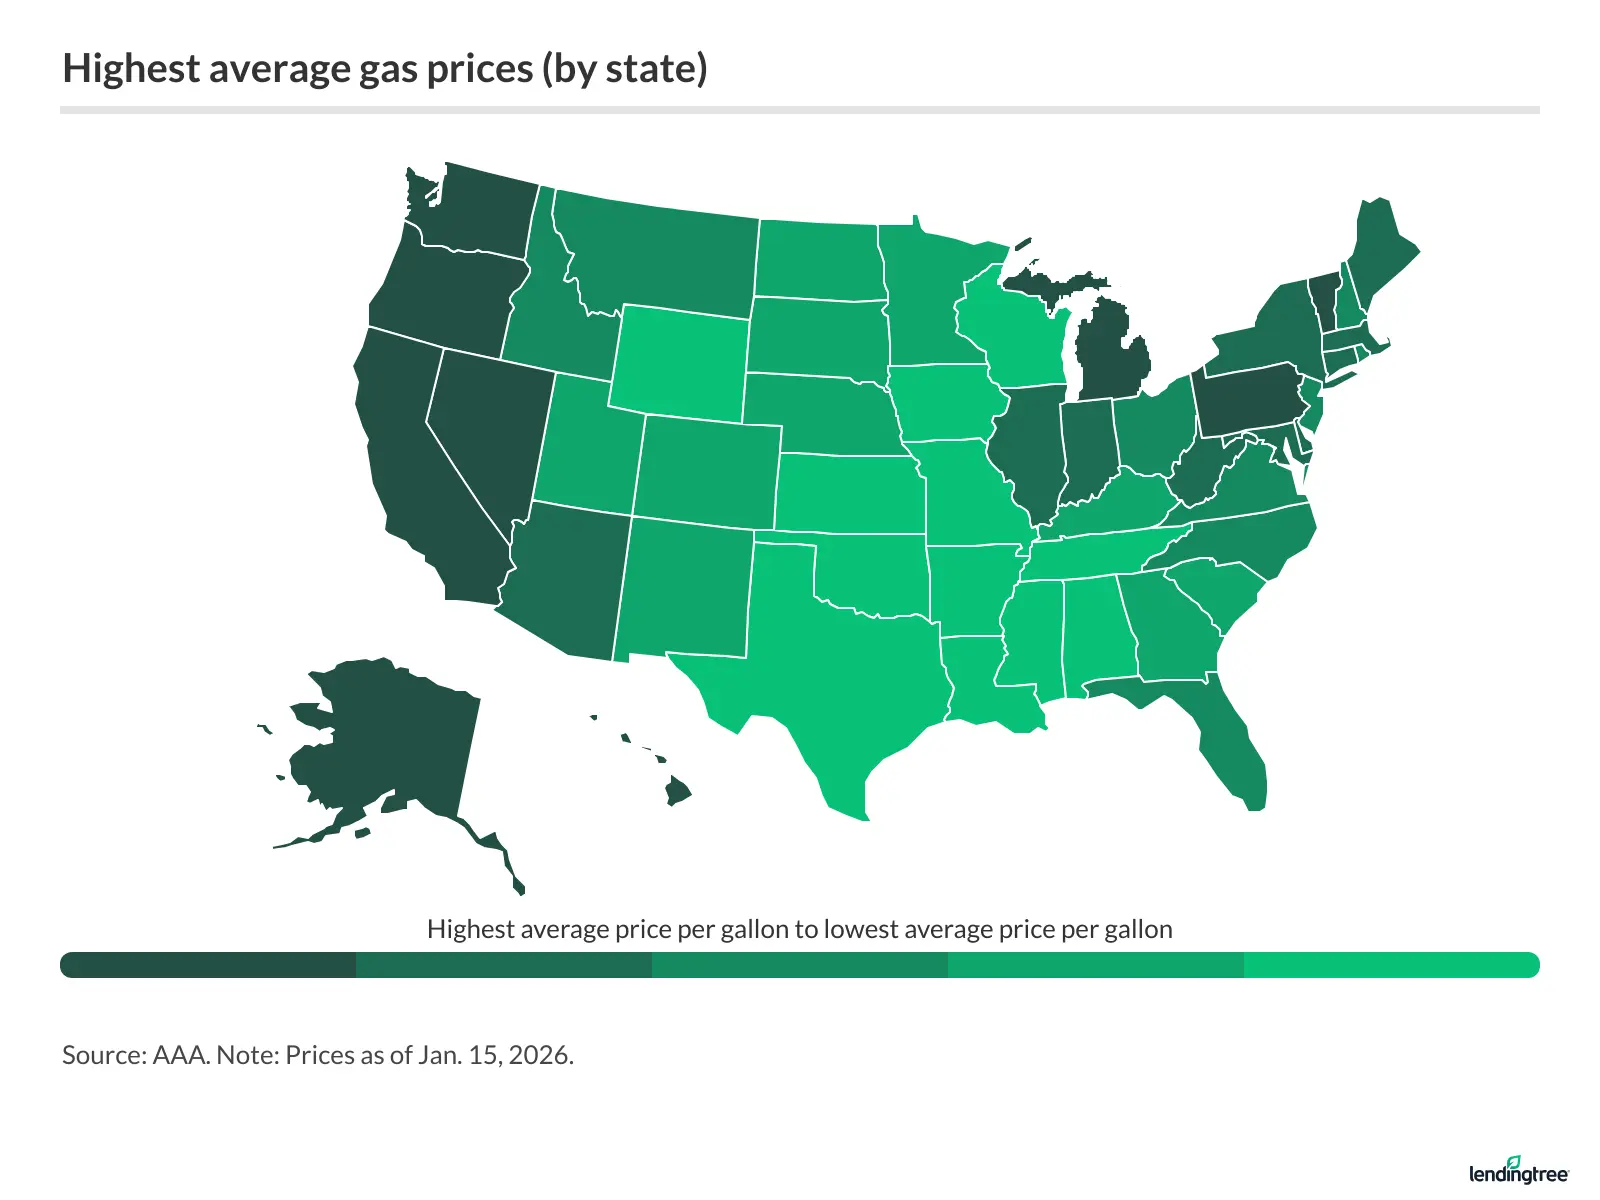
Average gas prices highest in Hawaii, lowest in Oklahoma
As of Jan. 15, 2026, the highest average gas price nationwide is in Hawaii ($4.41 per gallon). California ($4.21) and Washington ($3.80) follow.
States with highest average gas prices
| Rank | State | Avg. price per gallon |
|---|---|---|
| 1 | Hawaii | $4.41 |
| 2 | California | $4.21 |
| 3 | Washington | $3.80 |
| 4 | Alaska | $3.48 |
| 5 | Nevada | $3.35 |
Conversely, Oklahoma has the lowest average gas price at $2.32 per gallon, followed by Texas ($2.42) and Kansas, Louisiana and Mississippi (tied at $2.43).
States with lowest average gas prices
| Rank | State | Avg. price per gallon |
|---|---|---|
| 1 | Oklahoma | $2.32 |
| 2 | Texas | $2.42 |
| 3 | Kansas | $2.43 |
| 3 | Louisiana | $2.43 |
| 3 | Mississippi | $2.43 |
Full rankings
Highest average gas prices (by state)
| Rank | State | Avg. price per gallon | % difference from avg. U.S. gas price |
|---|---|---|---|
| 1 | Hawaii | $4.41 | 55.1% |
| 2 | California | $4.21 | 48.0% |
| 3 | Washington | $3.80 | 33.6% |
| 4 | Alaska | $3.48 | 22.4% |
| 5 | Nevada | $3.35 | 17.8% |
| 6 | Oregon | $3.34 | 17.4% |
| 7 | District of Columbia | $3.10 | 9.0% |
| 8 | Pennsylvania | $3.01 | 5.8% |
| 9 | Vermont | $3.00 | 5.5% |
| 9 | Michigan | $3.00 | 5.5% |
| 11 | New York | $2.99 | 5.1% |
| 11 | Maryland | $2.99 | 5.1% |
| 13 | Arizona | $2.96 | 4.1% |
| 14 | Illinois | $2.92 | 2.7% |
| 14 | Delaware | $2.92 | 2.7% |
| 16 | Massachusetts | $2.91 | 2.3% |
| 16 | Maine | $2.91 | 2.3% |
| 18 | Connecticut | $2.87 | 0.9% |
| 18 | West Virginia | $2.87 | 0.9% |
| 18 | Indiana | $2.87 | 0.9% |
| 21 | Rhode Island | $2.84 | -0.1% |
| 21 | Ohio | $2.84 | -0.1% |
| 23 | New Hampshire | $2.83 | -0.5% |
| 23 | Florida | $2.83 | -0.5% |
| 25 | Virginia | $2.78 | -2.3% |
| 26 | Idaho | $2.77 | -2.6% |
| 26 | New Jersey | $2.77 | -2.6% |
| 28 | Montana | $2.75 | -3.3% |
| 29 | North Carolina | $2.72 | -4.4% |
| 30 | Minnesota | $2.66 | -6.5% |
| 30 | Georgia | $2.66 | -6.5% |
| 32 | Utah | $2.63 | -7.5% |
| 33 | New Mexico | $2.62 | -7.9% |
| 34 | South Dakota | $2.60 | -8.6% |
| 34 | Kentucky | $2.60 | -8.6% |
| 36 | Nebraska | $2.58 | -9.3% |
| 37 | South Carolina | $2.56 | -10.0% |
| 37 | Colorado | $2.56 | -10.0% |
| 39 | North Dakota | $2.55 | -10.3% |
| 40 | Tennessee | $2.52 | -11.4% |
| 40 | Wisconsin | $2.52 | -11.4% |
| 42 | Iowa | $2.51 | -11.7% |
| 43 | Alabama | $2.50 | -12.1% |
| 44 | Wyoming | $2.49 | -12.4% |
| 45 | Missouri | $2.47 | -13.2% |
| 46 | Arkansas | $2.45 | -13.9% |
| 47 | Kansas | $2.43 | -14.6% |
| 47 | Louisiana | $2.43 | -14.6% |
| 47 | Mississippi | $2.43 | -14.6% |
| 50 | Texas | $2.42 | -14.9% |
| 51 | Oklahoma | $2.32 | -18.4% |
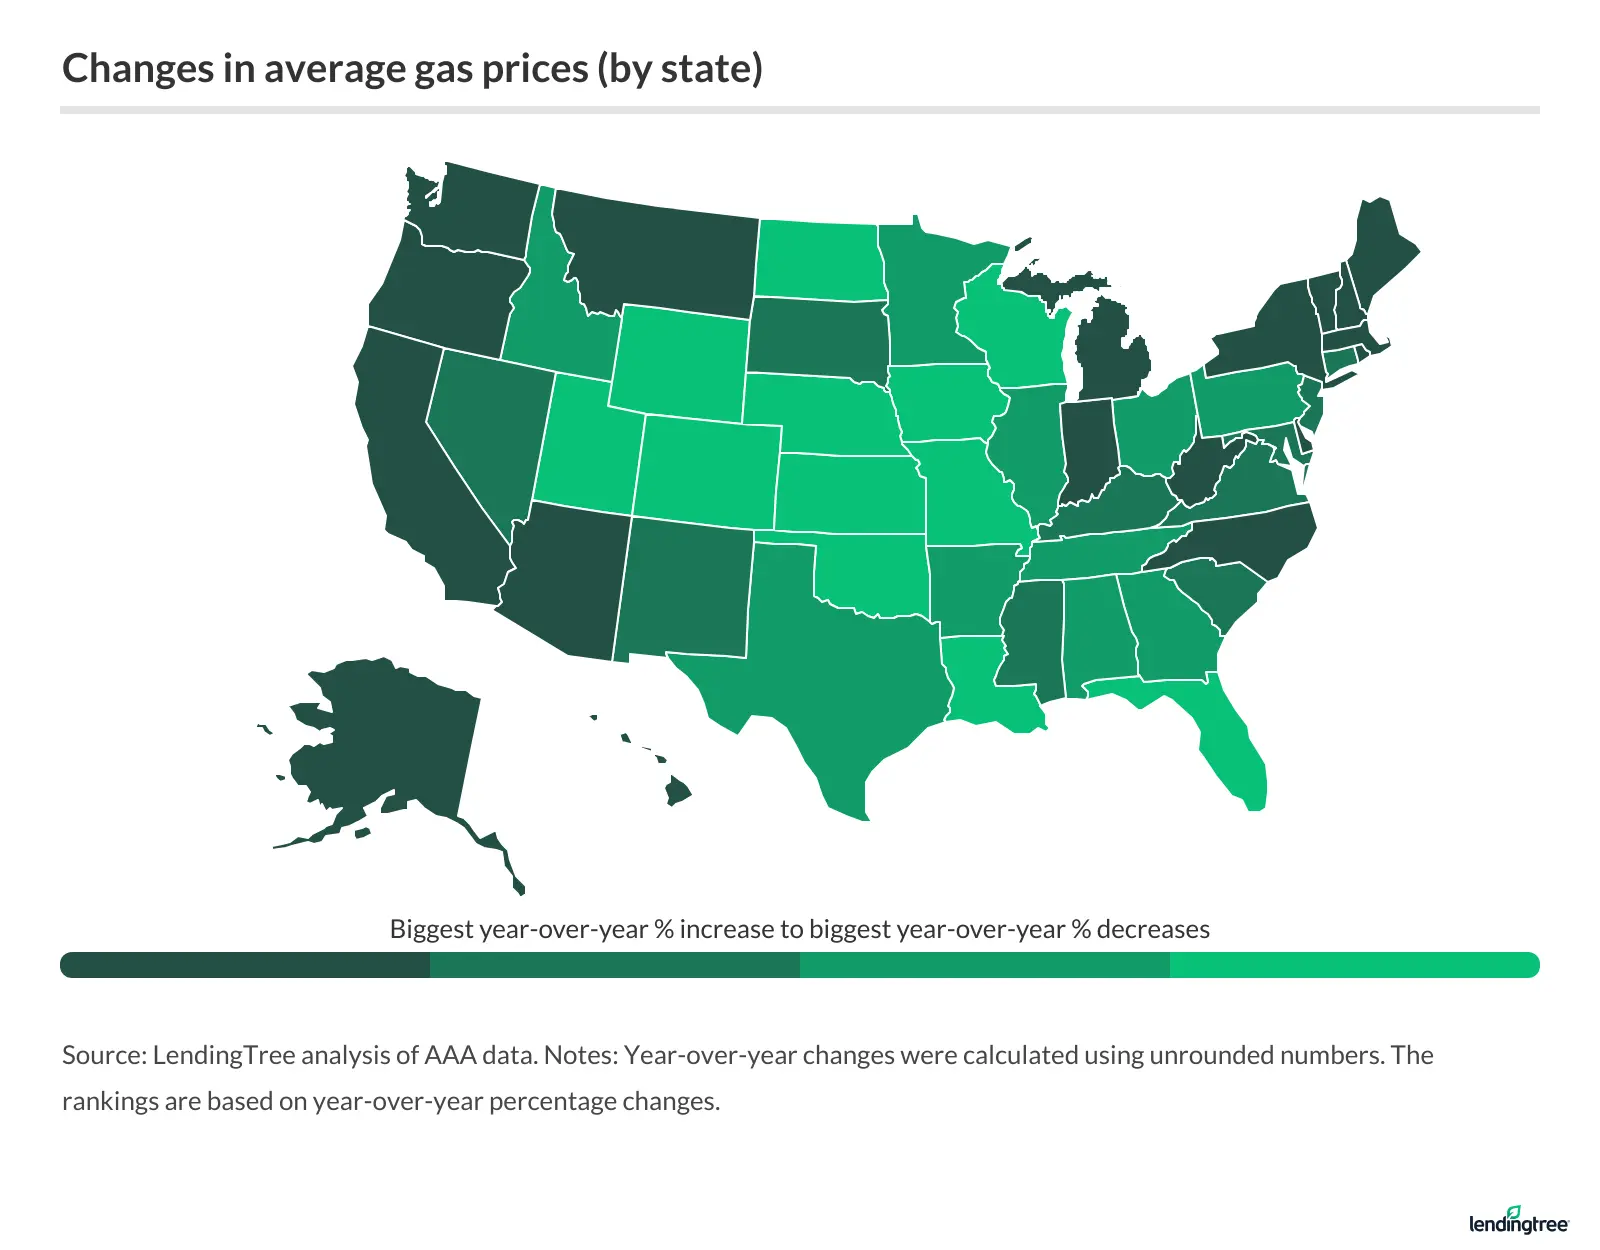
Where average gas prices fell the most
It’s also worth noting which states saw the biggest year-over-year changes. Average gas prices rose in only one state between Jan. 15, 2025, and Jan. 15, 2026.
In Alaska, the average gas price increased by 5.2% from $3.31 to $3.48 per gallon. The smallest decreases were in Washington (2.6%, from $3.90 to $3.80) and Hawaii (2.9%, from $4.54 to $4.41).
States with biggest increase/smallest decreases in average gas prices
| Rank | State | Avg. gas price, Jan. 15, 2026 | Avg. gas price, Jan. 15, 2025 | YoY % change | YoY $ change |
|---|---|---|---|---|---|
| 1 | Alaska | $3.48 | $3.31 | 5.2% | $0.17 |
| 2 | Washington | $3.80 | $3.90 | -2.6% | -$0.10 |
| 3 | Hawaii | $4.41 | $4.54 | -2.9% | -$0.13 |
| 4 | Arizona | $2.96 | $3.05 | -3.0% | -$0.09 |
| 5 | Michigan | $3.00 | $3.10 | -3.2% | -$0.10 |
Meanwhile, average gas prices decreased the most in Wyoming between Jan. 15, 2025, and Jan. 16, 2025. There, gas prices fell 15.0% from $2.93 to $2.49. Utah, where prices fell 13.2% from $3.03 to $2.63, and Iowa, where prices fell 13.1% from $2.89 to $2.51, followed.
States with biggest decreases in average gas prices
| Rank | State | Avg. gas price, Jan. 15, 2026 | Avg. gas price, Jan. 15, 2025 | YoY % change | YoY $ change |
|---|---|---|---|---|---|
| 1 | Wyoming | $2.49 | $2.93 | -15.0% | -$0.44 |
| 2 | Utah | $2.63 | $3.03 | -13.2% | -$0.40 |
| 3 | Iowa | $2.51 | $2.89 | -13.1% | -$0.38 |
| 4 | Oklahoma | $2.32 | $2.67 | -12.9% | -$0.35 |
| 5 | Wisconsin | $2.52 | $2.87 | -12.4% | -$0.36 |
Full rankings
Changes in average gas prices (by state)
| Rank | State | Avg. gas price, Jan. 15, 2026 | Avg. gas price, Jan. 15, 2025 | YoY % change | YoY $ change |
|---|---|---|---|---|---|
| 1 | Alaska | $3.48 | $3.31 | 5.2% | $0.17 |
| 2 | Washington | $3.80 | $3.90 | -2.6% | -$0.10 |
| 3 | Hawaii | $4.41 | $4.54 | -2.9% | -$0.13 |
| 4 | Arizona | $2.96 | $3.05 | -3.0% | -$0.09 |
| 5 | Michigan | $3.00 | $3.10 | -3.2% | -$0.10 |
| 6 | Massachusetts | $2.91 | $3.01 | -3.5% | -$0.11 |
| 6 | District of Columbia | $3.10 | $3.22 | -3.5% | -$0.11 |
| 8 | Montana | $2.75 | $2.85 | -3.6% | -$0.10 |
| 8 | Vermont | $3.00 | $3.11 | -3.6% | -$0.11 |
| 10 | Indiana | $2.87 | $2.98 | -3.8% | -$0.11 |
| 11 | Rhode Island | $2.84 | $2.95 | -3.9% | -$0.12 |
| 11 | New Hampshire | $2.83 | $2.95 | -3.9% | -$0.12 |
| 13 | California | $4.21 | $4.39 | -4.1% | -$0.18 |
| 14 | Oregon | $3.34 | $3.49 | -4.3% | -$0.15 |
| 15 | Maine | $2.91 | $3.04 | -4.5% | -$0.14 |
| 16 | West Virginia | $2.87 | $3.01 | -4.6% | -$0.14 |
| 17 | New York | $2.99 | $3.14 | -4.9% | -$0.15 |
| 18 | North Carolina | $2.72 | $2.86 | -5.1% | -$0.15 |
| 19 | Delaware | $2.92 | $3.09 | -5.3% | -$0.16 |
| 20 | Kentucky | $2.60 | $2.76 | -5.8% | -$0.16 |
| 21 | Maryland | $2.99 | $3.18 | -5.9% | -$0.19 |
| 22 | Connecticut | $2.87 | $3.05 | -6.0% | -$0.18 |
| 23 | Virginia | $2.78 | $2.98 | -6.7% | -$0.20 |
| 24 | New Jersey | $2.77 | $3.00 | -7.5% | -$0.23 |
| 25 | Nevada | $3.35 | $3.64 | -7.9% | -$0.29 |
| 26 | Mississippi | $2.43 | $2.65 | -8.3% | -$0.22 |
| 27 | New Mexico | $2.62 | $2.86 | -8.5% | -$0.24 |
| 28 | South Dakota | $2.60 | $2.85 | -8.6% | -$0.25 |
| 29 | South Carolina | $2.56 | $2.81 | -8.8% | -$0.25 |
| 30 | Pennsylvania | $3.01 | $3.32 | -9.1% | -$0.30 |
| 31 | Idaho | $2.77 | $3.05 | -9.4% | -$0.29 |
| 32 | Arkansas | $2.45 | $2.71 | -9.6% | -$0.26 |
| 33 | Alabama | $2.50 | $2.77 | -9.8% | -$0.27 |
| 33 | Texas | $2.42 | $2.69 | -9.8% | -$0.26 |
| 33 | Georgia | $2.66 | $2.95 | -9.8% | -$0.29 |
| 36 | Minnesota | $2.66 | $2.95 | -9.9% | -$0.29 |
| 36 | Tennessee | $2.52 | $2.79 | -9.9% | -$0.28 |
| 36 | Ohio | $2.84 | $3.15 | -9.9% | -$0.31 |
| 39 | Illinois | $2.92 | $3.25 | -10.1% | -$0.33 |
| 40 | Missouri | $2.47 | $2.77 | -10.8% | -$0.30 |
| 41 | Nebraska | $2.58 | $2.91 | -11.2% | -$0.33 |
| 41 | North Dakota | $2.55 | $2.87 | -11.2% | -$0.32 |
| 43 | Kansas | $2.43 | $2.74 | -11.3% | -$0.31 |
| 44 | Louisiana | $2.43 | $2.75 | -11.6% | -$0.32 |
| 45 | Colorado | $2.56 | $2.90 | -11.7% | -$0.34 |
| 46 | Florida | $2.83 | $3.22 | -11.9% | -$0.38 |
| 47 | Wisconsin | $2.52 | $2.87 | -12.4% | -$0.36 |
| 48 | Oklahoma | $2.32 | $2.67 | -12.9% | -$0.35 |
| 49 | Iowa | $2.51 | $2.89 | -13.1% | -$0.38 |
| 50 | Utah | $2.63 | $3.03 | -13.2% | -$0.40 |
| 51 | Wyoming | $2.49 | $2.93 | -15.0% | -$0.44 |
Biggest metro increases in Alaska
Metros (as designated by AAA) in Alaska saw the largest average gas price increases. In fact, of the 10 metros with the highest gas price increases, the top three are in Alaska.
Juneau saw the largest increase, with gas prices rising by 11.9% from $3.31 to $3.70. This was followed by Anchorage, where prices increased 5.6%, from $3.29 to $3.47, and Fairbanks, with a 3.5% increase from $3.21 to $3.32.
Metros with biggest increases in average gas prices
| Rank | Metro | Avg. gas price, Jan. 15, 2026 | Avg. gas price, Jan. 15, 2025 | YoY % change | YoY $ change |
|---|---|---|---|---|---|
| 1 | Juneau, AK | $3.70 | $3.31 | 11.9% | $0.39 |
| 2 | Anchorage, AK | $3.47 | $3.29 | 5.6% | $0.18 |
| 3 | Fairbanks, AK | $3.32 | $3.21 | 3.5% | $0.11 |
| 4 | Flagstaff, AZ | $3.18 | $3.08 | 3.0% | $0.10 |
| 5 | Pendleton, OR | $3.30 | $3.23 | 2.4% | $0.07 |
| 6 | Yuma, AZ | $2.97 | $2.90 | 2.2% | $0.07 |
| 7 | Fort Wayne, IN | $2.95 | $2.89 | 2.1% | $0.06 |
| 8 | Elkhart, IN | $2.93 | $2.90 | 0.9% | $0.03 |
| 9 | Benton Harbor, MI | $3.06 | $3.04 | 0.7% | $0.02 |
| 10 | Flint, MI | $3.08 | $3.07 | 0.5% | $0.01 |
Meanwhile, average gas prices decreased the most in Moorhead, Minn., falling by 21.9% from $2.91 to $2.28. Rounding out the top three are Cheyenne, Wyo., where prices decreased by 20.8% from $2.92 to $2.31, and Fargo-Moorhead, N.D., where prices dropped by 20.4% from $2.91 to $2.32.
Metros with biggest decreases in average gas prices
| Rank | Metro | Avg. gas price, Jan. 15, 2026 | Avg. gas price, Jan. 15, 2025 | YoY % change | YoY $ change |
|---|---|---|---|---|---|
| 1 | Moorhead, MN | $2.28 | $2.91 | -21.9% | -$0.63 |
| 2 | Cheyenne, WY | $2.31 | $2.92 | -20.8% | -$0.61 |
| 3 | Fargo-Moorhead (ND only), ND | $2.32 | $2.91 | -20.4% | -$0.59 |
| 4 | Casper, WY | $2.13 | $2.66 | -19.8% | -$0.53 |
| 5 | Pueblo, CO | $2.29 | $2.78 | -17.6% | -$0.49 |
| 6 | Glenwood Springs, CO | $2.85 | $3.45 | -17.3% | -$0.60 |
| 7 | Coeur d’Alene, ID | $2.39 | $2.86 | -16.4% | -$0.47 |
| 7 | Odessa, TX | $2.36 | $2.82 | -16.4% | -$0.46 |
| 7 | Council Bluffs, IA | $2.38 | $2.84 | -16.4% | -$0.46 |
| 10 | Mankato, MN | $2.53 | $3.02 | -16.3% | -$0.49 |
Utilizing credit cards for cash back at the gas station: Expert tips
The U.S. Energy Information Administration (EIA) forecasts gas prices to be $2.92 per gallon in 2026 and $2.95 per gallon in 2027.
LendingTree chief consumer finance analyst Matt Schulz says drivers can take a few steps to save on gas at the pump. First, he recommends shopping around.
“It doesn’t make sense to drive across town to save 3 cents a gallon, but gas prices can vary quite a bit even in a small area,” he says. “Driving an extra few blocks for a lower gas price can add up over a year, especially for drivers who fill up frequently.”
Next, Schulz advises leveraging credit cards with the best gas station rewards.
“Whether you’re loyal to one specific gas station chain or just looking to save on gas prices no matter where you fill up, plenty of credit cards can help you,” he says. “Just know that gas station-specific cards tend to have higher-than-average APRs, so make sure you pay them off in full every month if you’re going to use them. Otherwise, the amount you save on gas can quickly be outweighed by how much you accrue in interest.”
Methodology
LendingTree researchers analyzed AAA data on average regular gas prices in states and metros. Prices are as of Jan. 15, 2026, and are compared to those on Jan. 15, 2025.
U.S. Energy Information Administration (EIA) data was used to calculate average historical prices of regular gas per gallon.