Average Tax Refund Is $4,381, With 42% of Filers Reliant on It
The deadline for filing federal taxes is just one month away for most consumers.
Those who expect refunds may be in for a surprise: Our analysis of IRS data found the average refund for tax year 2022 — the latest available full-year data — was $4,381. That’s the highest average in the past five years.
Still, just 4% of tax filers think they’ll receive a refund of $4,000 to $4,999 this tax season, according to the latest LendingTree survey of nearly 2,000 U.S. consumers.
Here’s a closer look.
Key findings
- The average refund for tax year 2022 — the latest available full-year data — was $4,381. That’s slightly higher than the average of $4,264 in tax year 2021.
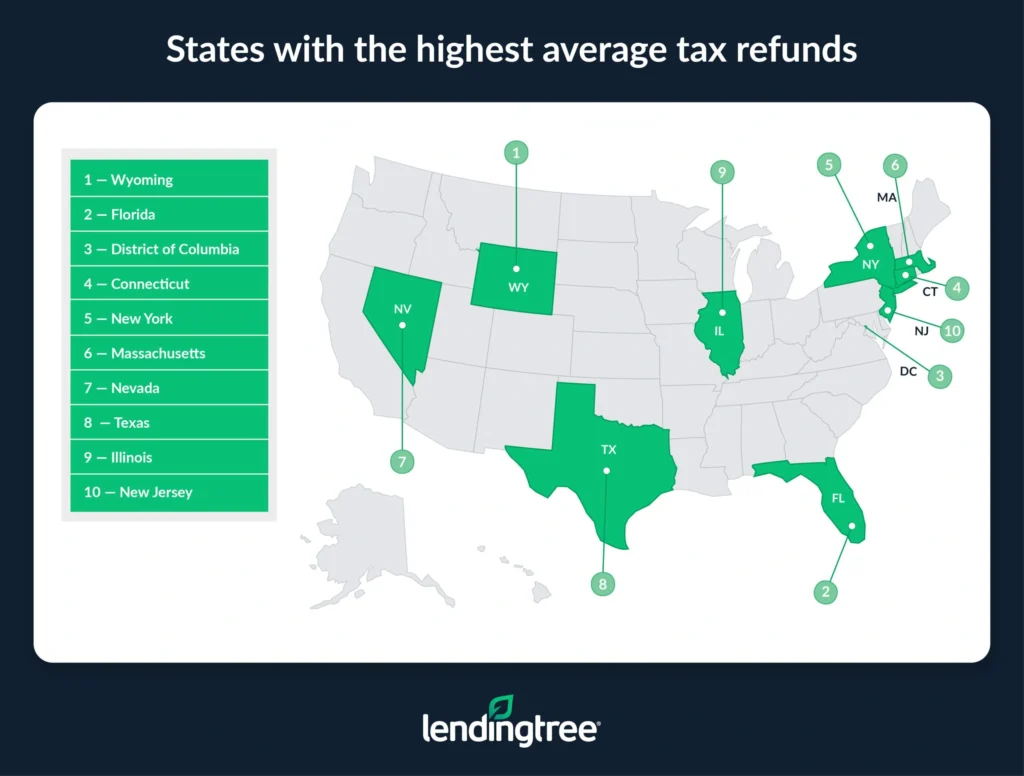
- For the fifth year in a row, Wyoming residents received the largest average refunds. Wyoming taxpayers who overpaid received an average of $6,367 from Uncle Sam. Florida ($5,934) and the District of Columbia ($5,848) followed.
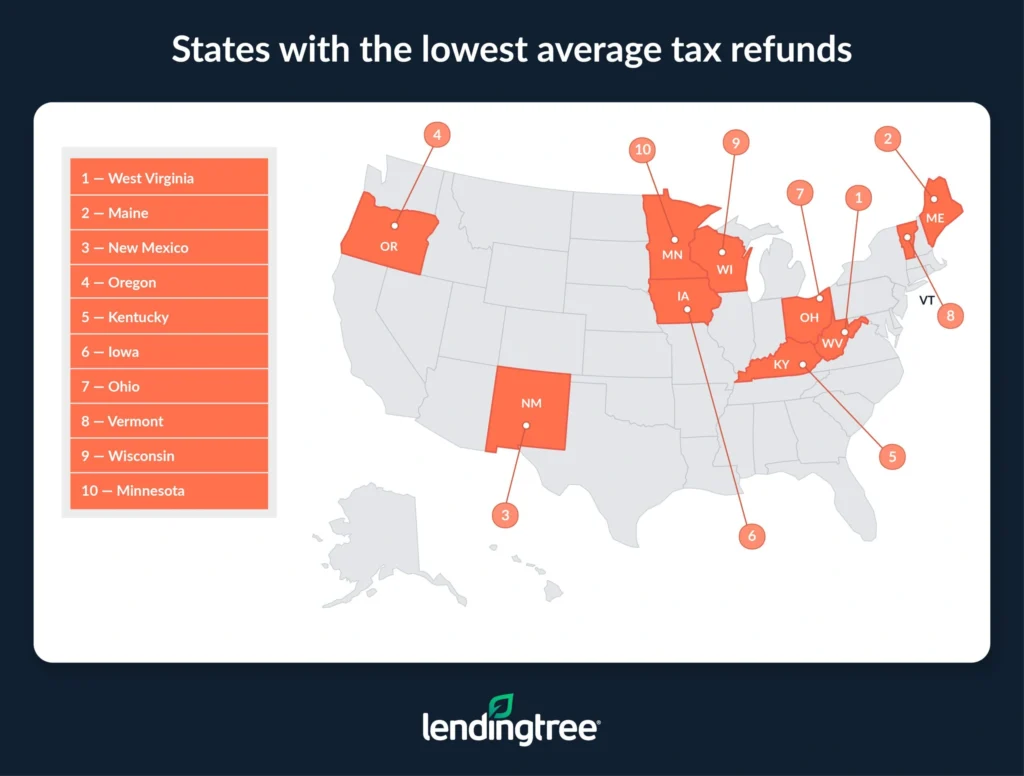
- West Virginia taxpayers had the lowest average refunds. Those owed refunds received an average of $3,183 — down from $3,251 in the prior tax year. Maine, whose taxpayers had the lowest average refunds four years in a row, was second-lowest at $3,199. New Mexico ($3,394) was third-lowest.
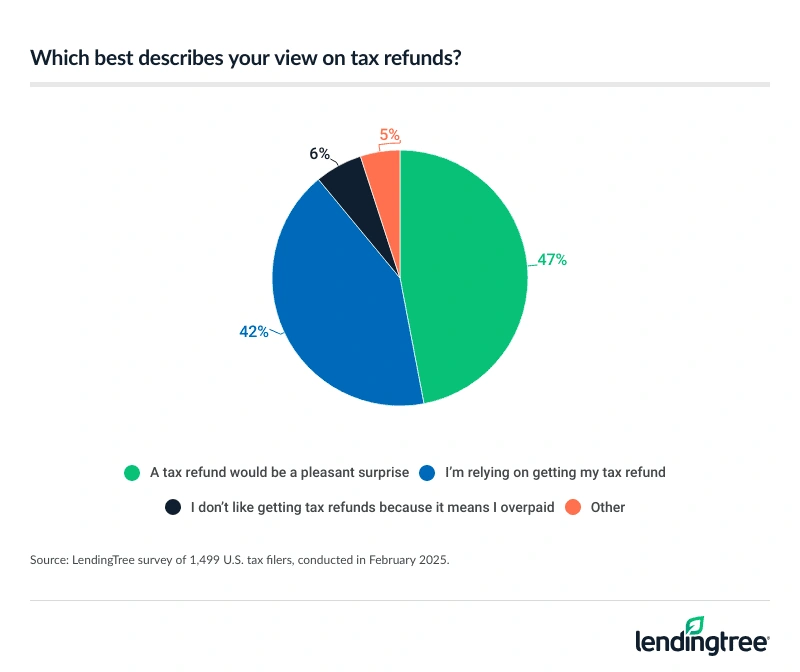
- Of the 75% of Americans who plan to file a federal tax return, 42% are relying on their refund. That’s a slight increase from 40% last year. Notably, 54% of parents with children younger than 18 are reliant on their refunds — the only demographic over 50%.
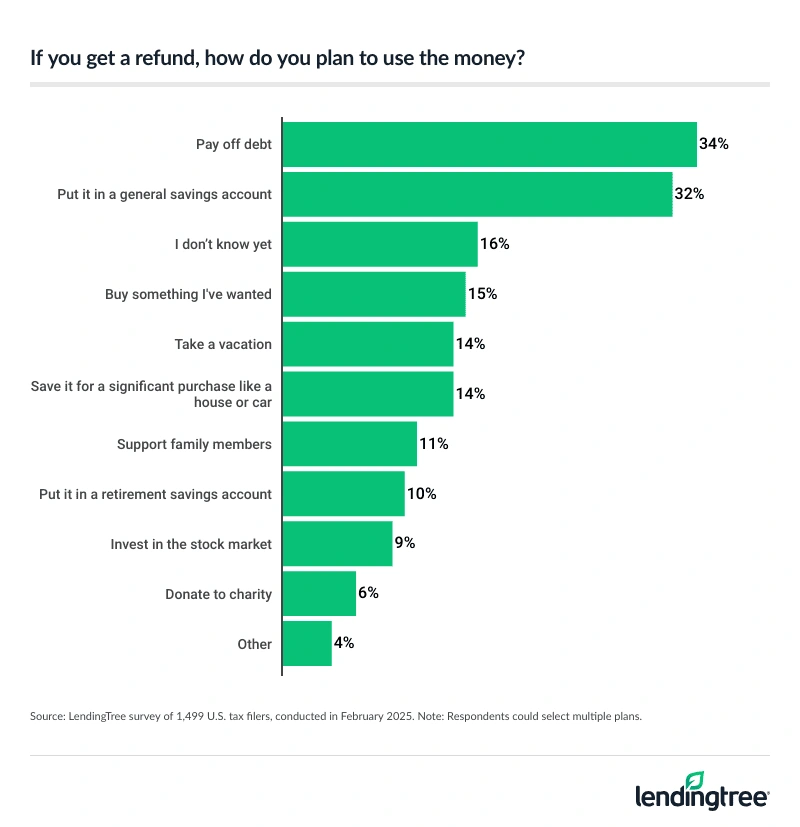
- Most American tax filers plan to be responsible with their refunds. When asked how they’d use their refund if they got one, 34% planned to pay down debt, while 32% planned to put it toward savings. Those who receive refunds may be able to do more than they expect: Despite our data on tax year 2022, 28% of tax filers think their refund will be less than $500. Just 4% think they’ll receive $4,000 to $4,999.
Those receiving refunds got average of $4,381
For tax year 2022, the average refund was $4,381. That marks a continued increase from previous years: Refunds were an average $4,264 for tax year 2021, $3,745 for tax year 2020 and $3,651 for tax year 2019.
Average refund by year
| Tax year | Avg. refund |
|---|---|
| 2018 | $3,660 |
| 2019 | $3,651 |
| 2020 | $3,745 |
| 2021 | $4,264 |
| 2022 | $4,381 |
Matt Schulz — LendingTree chief consumer finance analyst and author of “Ask Questions, Save Money, Make More: How to Take Control of Your Financial Life” — says that amount is about in line with what he’d expect.
“That creates a real opportunity for people receiving a refund,” he says. “That money can be put toward knocking down high-interest debt, building an emergency fund, investing for retirement or other big financial goals. It gives them more financial wiggle room when many Americans desperately need it.”
The highest-earning taxpayers by far receive the largest refunds. On average, Americans with adjusted gross income of $1 million or more received a refund of $246,696. That’s a dramatic difference from the next income bracket: Those earning at least $500,000 but less than $1 million saw an average refund of $39,519.
Those earning at least $1 but less than $10,000 had the lowest refunds, at an average of $1,050. Notably, those who didn’t report any earnings received an average refund of $6,759 based on credits and deductions.
Average refund by income
| Income | Avg. refund |
|---|---|
| Under $1 | $6,759 |
| $1 to $9,999 | $1,050 |
| $10,000 to $24,999 | $2,749 |
| $25,000 to $49,999 | $2,675 |
| $50,000 to $74,999 | $2,595 |
| $75,000 to $99,999 | $3,255 |
| $100,000 to $199,999 | $4,449 |
| $200,000 to $499,999 | $10,960 |
| $500,000 to $999,999 | $39,519 |
| $1 million or more | $246,696 |
Across the U.S., those receiving refunds credited an average of $29,938 toward next year’s taxes. That’s largely driven by high earners, with those earning $1 million or more crediting an average of $259,402 toward next year’s taxes. Those earning at least $500,000 but less than $1 million put an average of $42,733 toward the next tax season.
Wyoming residents again had highest refunds
Wyoming residents received the largest average refunds for the fifth year in a row. Taxpayers who overpaid received an average of $6,367 — up 7.7% from $5,914 in the prior tax year.
Florida ($5,934) and the District of Columbia ($5,848) had the next highest tax refunds. Notably, Florida saw the biggest year-over-year percentage jump in tax refunds, rising 18.6% from $5,005 in tax year 2021.

Meanwhile, West Virginia taxpayers had the lowest average refunds, rising from second when we last conducted this study. West Virginia taxpayers receiving refunds got an average of $3,183 — down 2.1% from $3,251 in the prior tax year.
Maine was second-lowest at $3,199. That marks a significant change from prior tax years: Taxpayers here received the lowest average refunds four years in a row. New Mexico ($3,394) followed.

Full rankings
States where taxpayers receive the highest/lowest average refunds
| Rank | State | Avg. refund |
|---|---|---|
| 1 | Wyoming | $6,367 |
| 2 | Florida | $5,934 |
| 3 | District of Columbia | $5,848 |
| 4 | Connecticut | $5,284 |
| 5 | New York | $5,263 |
| 6 | Massachusetts | $5,092 |
| 7 | Nevada | $5,090 |
| 8 | Texas | $4,921 |
| 9 | Illinois | $4,604 |
| 10 | New Jersey | $4,541 |
| 11 | Washington | $4,412 |
| 12 | Colorado | $4,369 |
| 13 | California | $4,358 |
| 14 | Louisiana | $4,319 |
| 15 | Georgia | $4,236 |
| 16 | Maryland | $4,227 |
| 17 | Virginia | $4,222 |
| 18 | Utah | $4,189 |
| 19 | New Hampshire | $4,112 |
| 20 | North Dakota | $4,105 |
| 21 | South Dakota | $4,094 |
| 22 | Tennessee | $4,033 |
| 23 | Montana | $3,990 |
| 24 | Arizona | $3,981 |
| 25 | Arkansas | $3,978 |
| 26 | Oklahoma | $3,969 |
| 27 | Alaska | $3,960 |
| 28 | Hawaii | $3,899 |
| 29 | Michigan | $3,894 |
| 30 | Alabama | $3,891 |
| 31 | Mississippi | $3,881 |
| 32 | Kansas | $3,880 |
| 33 | Pennsylvania | $3,859 |
| 34 | Idaho | $3,835 |
| 35 | Nebraska | $3,798 |
| 36 | North Carolina | $3,784 |
| 37 | South Carolina | $3,760 |
| 38 | Missouri | $3,735 |
| 39 | Delaware | $3,692 |
| 40 | Indiana | $3,686 |
| 41 | Rhode Island | $3,671 |
| 42 | Minnesota | $3,664 |
| 43 | Wisconsin | $3,580 |
| 44 | Vermont | $3,575 |
| 45 | Ohio | $3,562 |
| 46 | Iowa | $3,537 |
| 47 | Kentucky | $3,490 |
| 48 | Oregon | $3,472 |
| 49 | New Mexico | $3,394 |
| 50 | Maine | $3,199 |
| 51 | West Virginia | $3,183 |
Average tax refund by tax year and state
| State | Tax year 2018 | Tax year 2019 | Tax year 2020 | Tax year 2021 | Tax year 2022 |
|---|---|---|---|---|---|
| Alabama | $3,391 | $3,298 | $3,422 | $3,986 | $3,891 |
| Alaska | $3,549 | $3,485 | $3,664 | $3,960 | $3,960 |
| Arizona | $3,395 | $3,352 | $3,466 | $3,963 | $3,981 |
| Arkansas | $3,333 | $3,291 | $3,367 | $4,098 | $3,978 |
| California | $3,992 | $4,010 | $4,030 | $4,671 | $4,358 |
| Colorado | $3,545 | $3,537 | $3,701 | $4,123 | $4,369 |
| Connecticut | $4,452 | $4,461 | $4,280 | $4,877 | $5,284 |
| Delaware | $3,145 | $3,132 | $3,279 | $3,667 | $3,692 |
| District of Columbia | $4,403 | $4,356 | $4,462 | $5,381 | $5,848 |
| Florida | $4,285 | $4,301 | $4,337 | $5,005 | $5,934 |
| Georgia | $3,529 | $3,461 | $3,552 | $4,272 | $4,236 |
| Hawaii | $3,268 | $3,271 | $3,556 | $3,835 | $3,899 |
| Idaho | $3,072 | $3,046 | $3,345 | $3,796 | $3,835 |
| Illinois | $3,839 | $3,708 | $3,946 | $4,493 | $4,604 |
| Indiana | $3,172 | $3,100 | $3,244 | $3,650 | $3,686 |
| Iowa | $3,057 | $2,952 | $3,132 | $3,476 | $3,537 |
| Kansas | $3,359 | $3,292 | $3,423 | $3,837 | $3,880 |
| Kentucky | $3,137 | $3,085 | $3,230 | $3,562 | $3,490 |
| Louisiana | $3,734 | $3,660 | $3,792 | $4,617 | $4,319 |
| Maine | $2,743 | $2,752 | $2,920 | $3,144 | $3,199 |
| Maryland | $3,489 | $3,583 | $3,703 | $4,076 | $4,227 |
| Massachusetts | $4,115 | $4,175 | $4,119 | $5,078 | $5,092 |
| Michigan | $3,303 | $3,229 | $3,433 | $3,790 | $3,894 |
| Minnesota | $3,078 | $3,045 | $3,197 | $3,534 | $3,664 |
| Mississippi | $3,390 | $3,322 | $3,422 | $4,067 | $3,881 |
| Missouri | $3,200 | $3,187 | $3,321 | $3,740 | $3,735 |
| Montana | $3,049 | $3,058 | $3,182 | $3,666 | $3,990 |
| Nebraska | $3,163 | $3,092 | $3,234 | $3,714 | $3,798 |
| Nevada | $4,041 | $3,874 | $4,099 | $4,884 | $5,090 |
| New Hampshire | $3,264 | $3,240 | $3,453 | $3,803 | $4,112 |
| New Jersey | $3,777 | $3,986 | $3,858 | $4,490 | $4,541 |
| New Mexico | $3,149 | $3,159 | $3,284 | $3,454 | $3,394 |
| New York | $4,376 | $4,444 | $4,189 | $4,981 | $5,263 |
| North Carolina | $3,177 | $3,130 | $3,241 | $3,652 | $3,784 |
| North Dakota | $3,530 | $3,564 | $3,682 | $4,102 | $4,105 |
| Ohio | $3,048 | $3,023 | $3,176 | $3,571 | $3,562 |
| Oklahoma | $3,542 | $3,503 | $3,675 | $3,946 | $3,969 |
| Oregon | $2,970 | $2,896 | $3,095 | $3,422 | $3,472 |
| Pennsylvania | $3,290 | $3,232 | $3,456 | $3,765 | $3,859 |
| Rhode Island | $3,157 | $3,172 | $3,354 | $3,558 | $3,671 |
| South Carolina | $3,135 | $3,147 | $3,239 | $3,775 | $3,760 |
| South Dakota | $3,476 | $3,383 | $3,498 | $3,899 | $4,094 |
| Tennessee | $3,410 | $3,361 | $3,472 | $3,949 | $4,033 |
| Texas | $4,082 | $4,123 | $4,317 | $4,753 | $4,921 |
| Utah | $3,444 | $3,413 | $3,713 | $4,187 | $4,189 |
| Vermont | $2,914 | $2,924 | $3,143 | $3,407 | $3,575 |
| Virginia | $3,476 | $3,424 | $3,539 | $3,993 | $4,222 |
| Washington | $3,683 | $3,692 | $4,049 | $4,190 | $4,412 |
| West Virginia | $3,009 | $2,963 | $3,102 | $3,251 | $3,183 |
| Wisconsin | $2,997 | $2,976 | $3,072 | $3,479 | $3,580 |
| Wyoming | $4,602 | $5,027 | $4,877 | $5,914 | $6,367 |
High percentage of tax filers relying on refunds
This year, 75% of Americans plan to file a federal tax return — and 42% of them are relying on their refund. That’s up from 40% last year.

Parents with children younger than 18 (54%), millennials ages 29 to 44 (49%) and those earning less than $30,000 (48%) are the most likely to rely on a refund.
Schulz says that’s concerning, but it shouldn’t be surprising.
“Millions of American families have little to no margin for error financially,” he says. “They’re living paycheck to paycheck on a tight budget, and a substantial tax refund can make things significantly easier for them.”
Consumers plan to stash their refunds
There’s some good news, though: Consumers plan to be responsible with their refund money. In fact, 34% of tax filers would pay down debt if they get a refund this year. Meanwhile, 32% plan to put it toward savings.

Schulz believes that’s generally a good sign. “There’s nothing wrong with taking a piece of the return and having some fun with it, but if you have high-interest debt and you’re working toward big long-term financial goals, the vast majority of the refund should go toward those things,” he says. “If it doesn’t, it’s a serious missed opportunity.”
While just 9% plan to invest in the stock market with their refunds, that figure increases significantly to 16% among Gen Zers ages 18 to 28.
That’s also good news, according to Schulz.
“When it comes to investing, there’s no greater asset than time,” he says. “By starting now, Gen Zers can take advantage of it in a huge way. Of course, there’s always risk involved with the stock market. If Gen Zers put most of their refunds in crypto, meme stocks and day trading, it may not work out great. However, if they’re cautious, patient and doing most of their investing in less sexy things like index funds and dividend stocks, the odds are that in the long run, they’ll end up far ahead of those who waited to jump in.”
Refunds may be bigger than consumers expect. Although our data on tax year 2022 indicates average returns are high, a significant 28% of American tax filers think their refund will be less than $500. Just 4% think they’ll receive the $4,000 to $4,999 we found taxpayers received in 2022. The full breakdown:
- 28% think they’ll get less than $500
- 17% think they’ll get $500 to $999
- 16% think they’ll get $1,000 to $1,999
- 10% think they’ll get $2,000 to $2,999
- 7% think they’ll get $3,000 to $3,999
- 4% think they’ll get $4,000 to $4,999
- 7% think they’ll get $5,000 or more
- 11% expect they’ll owe money
Preparing for future tax years: Top expert tips
When it comes to how consumers file their taxes, 38% use a free online filing service and 22% use a paid online filing service — meaning there’s a lot more room for error compared to the 34% who use an accountant or tax specialist. To prepare for the next tax season, Schulz offers the following advice:
- Reduce next year’s refund. “You don’t want a big refund,” he says. “If you’re getting a refund, you’ve essentially given the U.S. government an interest-free loan for the past year. Instead, try to adjust your withholdings so you’ll neither get a refund nor have to pay with next year’s tax return. That way, you’ll be keeping more of your own money, which you can invest or put into a high-yield savings account instead of letting it earn money for the government.”
- Build savings while paying down debt. “It can be tempting to put every cent of that refund to paying down debt,” Schulz says. “However, if you don’t have an emergency fund or think it’s too small, your smarter move may be to put some of that refund toward growing that. Yes, it means it’ll take longer and cost a little more to pay down your debt. However, having savings when you finally pay off that debt means that the next big, unexpected expense won’t just have to go back on your credit card. It can be paid, at least in part, with savings. That’s how you go a long way toward breaking the cycle of debt.”
Methodology
LendingTree researchers analyzed federal individual income tax returns (Form 1040s) filed from Jan. 1 through Dec. 31, 2023, for tax year 2022 — the latest full-year data available — from the IRS Statistics of Income program.
To estimate the average refund in the U.S. and each state, researchers divided the total amount refunded by the number of people who received refunds.
Additionally, LendingTree commissioned QuestionPro to conduct an online survey of 1,999 U.S. consumers ages 18 to 79 from Feb. 4 to 5, 2025. The survey was administered using a nonprobability-based sample, and quotas were used to ensure the sample base represented the overall population. Researchers reviewed all responses for quality control.
We defined generations as the following ages in 2025:
- Generation Z: 18 to 28
- Millennial: 29 to 44
- Generation X: 45 to 60
- Baby boomer: 61 to 79
Get debt consolidation loan offers from up to 5 lenders in minutes

