The High Price of Parenting: Infant Care Outpaces Rent in 11 Metros


Raising a child isn’t cheap. In fact, the annual costs associated with raising a small child are $29,419.
For those with young kids, child care can be a major expense. According to LendingTree research, the average monthly cost of infant care across the 100 largest U.S. metros is 25.3% lower than the average monthly cost of rent for a two-bedroom unit, while caring for an infant and a 4-year-old costs 31.5% more than rent.
Here’s a look at where those costs are highest and lowest.
Key findings
- Across the 100 largest U.S. metros, the average monthly cost of full-time center-based infant care is $1,282 — 25.3% less than the average monthly cost of $1,716 to rent a two-bedroom unit. However, the cost of infant care exceeds the cost of rent in 11 metros.
- Infant care costs in Springfield, Mass., are 15.1% higher than rent. While average monthly infant care there costs $1,996, the average rent for a two-bedroom is $1,734. Milwaukee (14.8%) and Wichita, Kan. (14.3%), have the next largest gaps.
- For families with two kids, child care costs exceed rent in 85 of the 100 metros analyzed. That’s looking at care costs for an infant and a 4-year-old and rent for a two-bedroom unit. The biggest disparities are in Omaha, Neb. (111.3%), Milwaukee (110.9%) and Buffalo, N.Y. (105.6%).
- Caring for two children is significantly cheaper than rent in California and Florida metros. In San Jose, Calif., child care costs 38.4% less than rent. San Francisco (37.6%) and San Diego (29.4%) follow. In total, six of the 10 metros where this is most common are in California, while the remaining four are in Florida.
Child care rivals rent in 100 largest metros
The average monthly cost of full-time center-based infant care across the 100 largest metros is $1,282. Meanwhile, the average monthly cost to rent a two-bedroom unit across the same 100 metros is $1,716.
That means that infant child care costs are 25.3% less than rent.
Matt Schulz — LendingTree chief consumer finance analyst and author of “Ask Questions, Save Money, Make More: How to Take Control of Your Financial Life” — says these average costs are incredibly significant for families.
“Spending almost $1,300 a month on child care is a massive burden for parents, but most families don’t have another choice,” he says. “They can’t stay home. They don’t have family or friends they can rely on for child care. They have no other option but to put up a ton of money each month for child care. It makes an already difficult financial situation that much more challenging.”
When we conducted this study last year, the average monthly cost of child care was $1,218 — 22.2% lower than the average monthly rent of $1,566. While child care costs haven’t changed much in that period, rent has increased slightly.
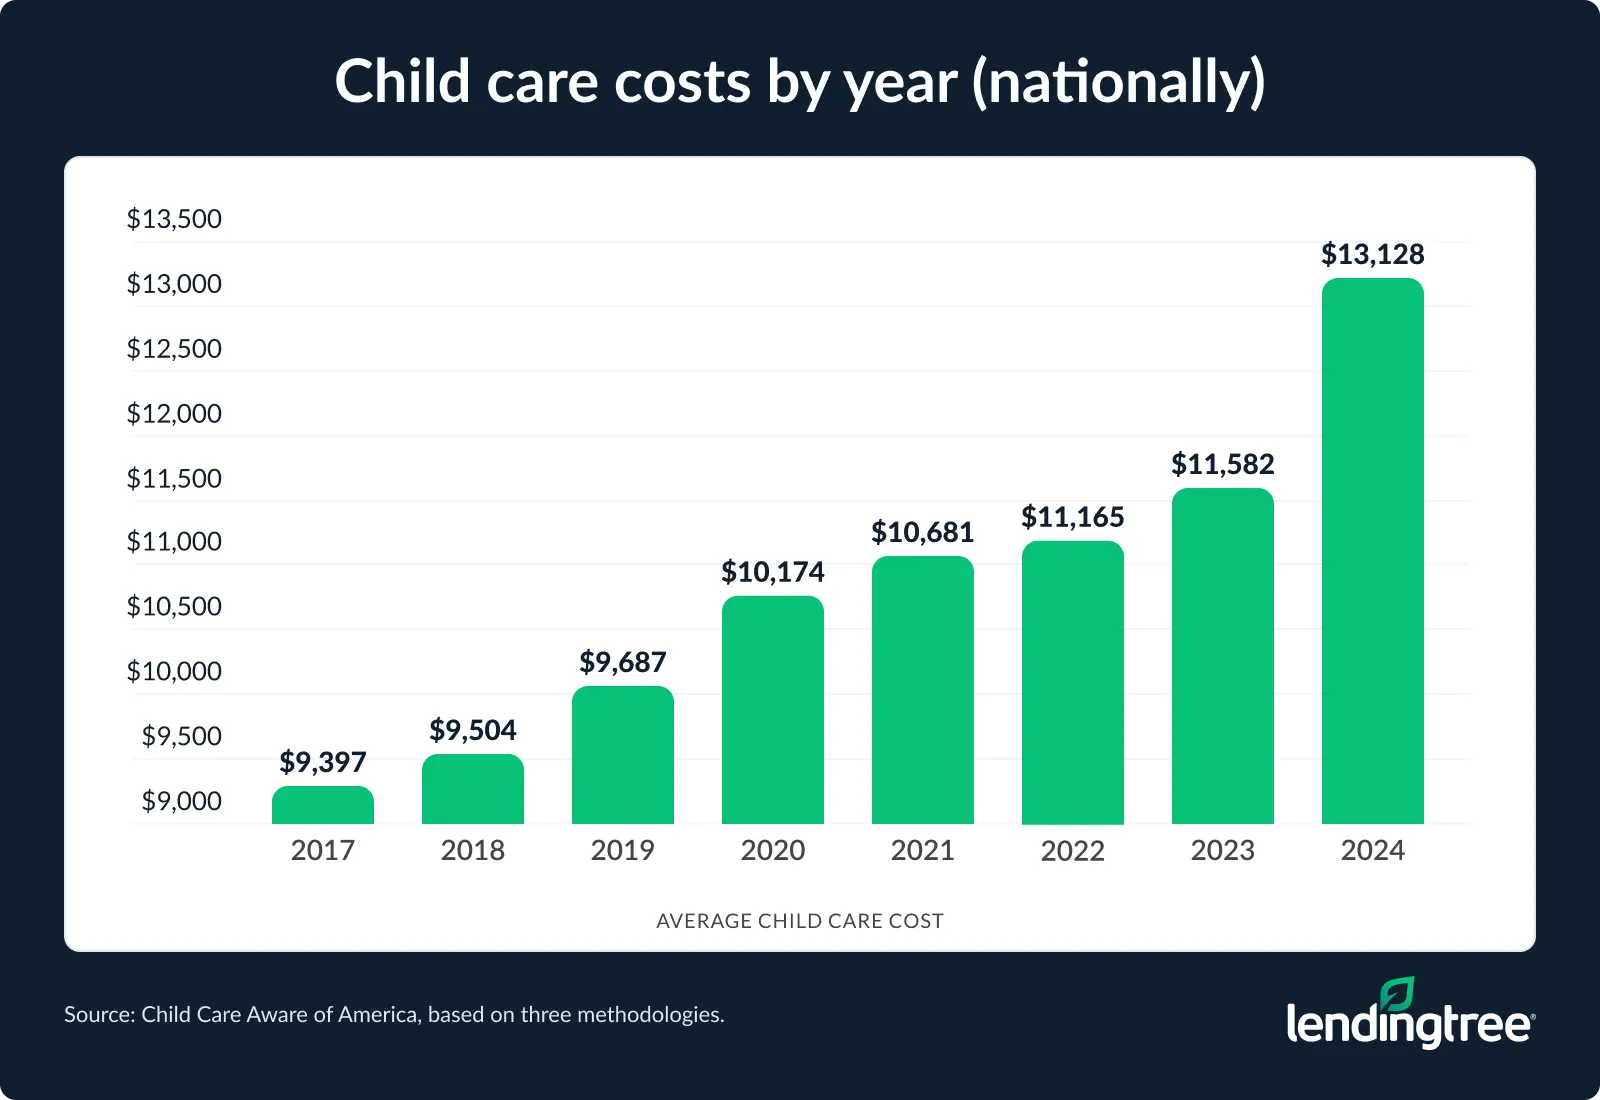
However, child care costs have been rising for some time. According to Child Care Aware of America, the average cost of child care rose 13.3% between 2023 and 2024, from $11,582 per child to $13,128. That’s up an even more significant 35.5% from 2019.
Worth noting, though: In this year’s study, we found that infant care costs exceed rent in 11 metros. We’ll get into that below.
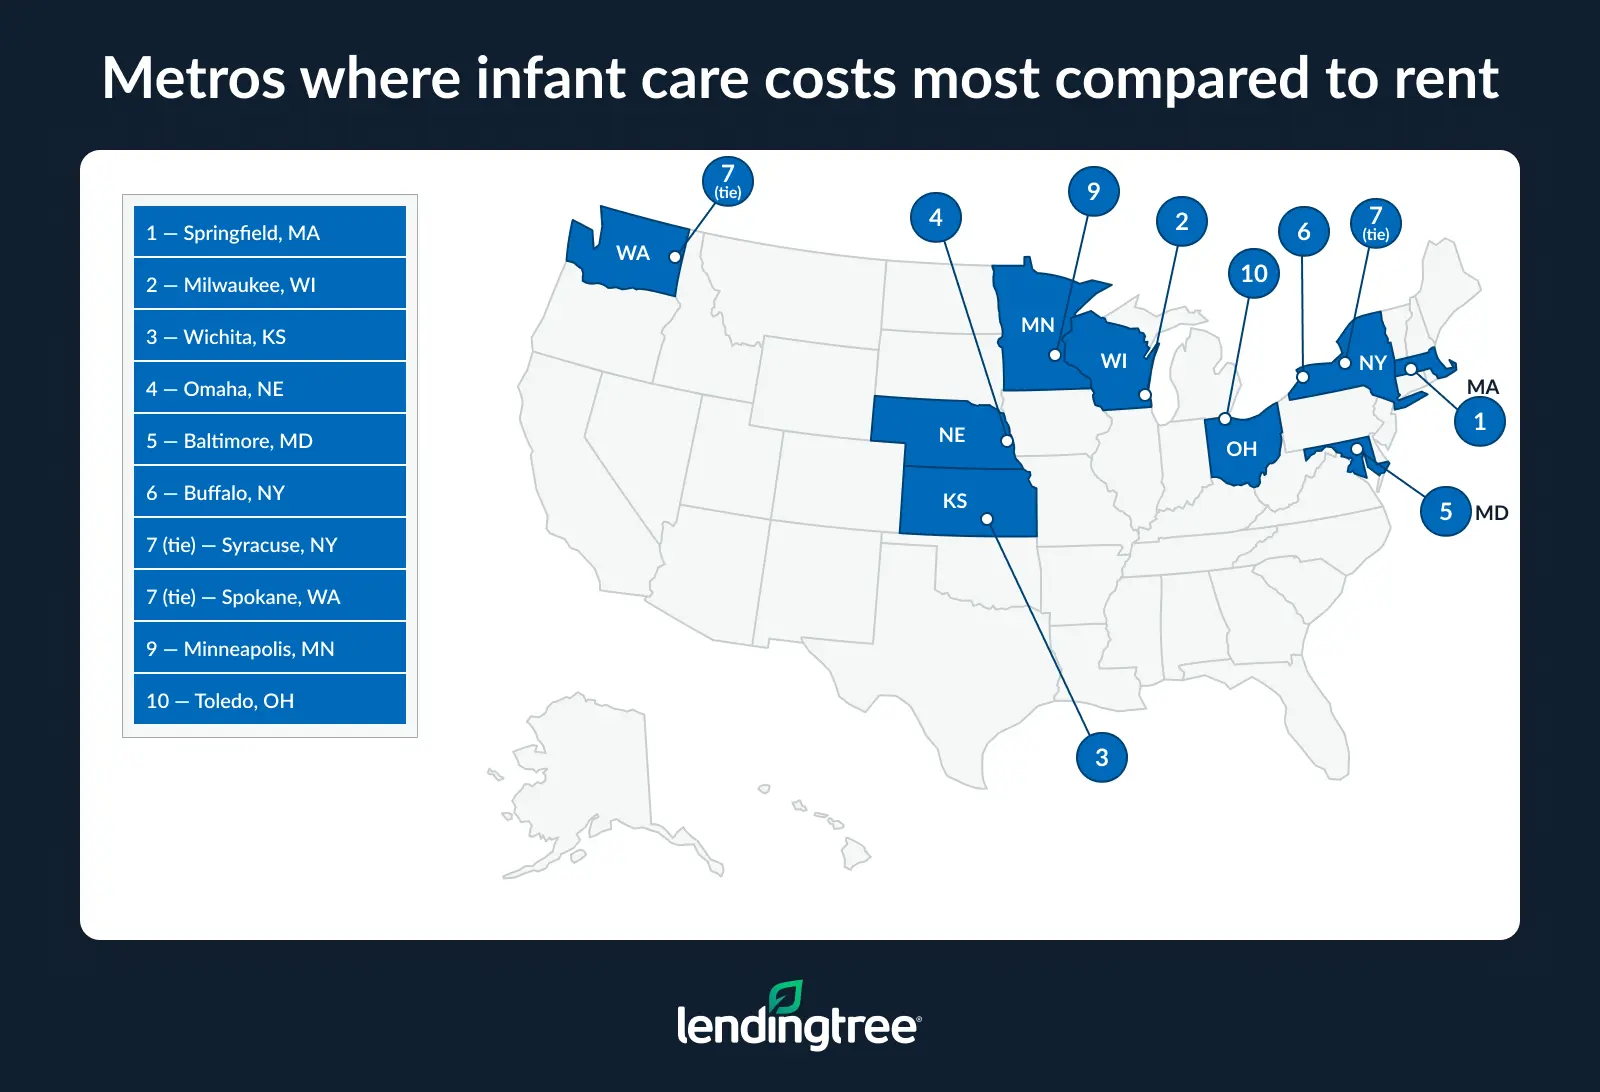
Child care for infant more expensive than rent in these metros
By metro, infant care costs in Springfield, Mass., exceed rent the most. While average monthly infant care there costs $1,996, the average rent for a two-bedroom is $1,734 — meaning child care is 15.1% higher than rent.
Springfield ranked first in last year’s study, too, with child care being a more significant 32.3% higher than rent — though average child care ($1,819) and rent ($1,375) were both cheaper than this year.
Milwaukee (14.8%) ranks next, rising from No. 18 in last year’s study. Here, child care costs $1,536, while rent costs $1,338. Wichita, Kan. (14.3%), ranks third for the second year in a row, with child care costing $1,256 and rent costing $1,099.
Schulz says those costs can be significant for parents in these metros, but it’s better to focus on rent rather than child care.
“High child care costs may require some sacrifice, but it’s important to remember that day care isn’t a forever expense,” he says, “With that in mind, it might make sense to focus on keeping housing costs down during that period in which you’re paying for child care regularly.”
Conversely, infant care costs are 53.2% lower than rent in Miami — the lowest by metro. Here, child care costs $1,139, while rent for a two-bedroom apartment costs a whopping $2,436. San Jose, Calif. (53.1%), San Francisco (52.5%) and Austin, Texas (50.2%), are the only other metros where child care costs are at least 50% less than rent.
Full rankings: Metros where infant care costs most/least compared to rent
| Rank | Metro | Avg. monthly infant care cost | Avg. monthly 2-bedroom rent | % difference | $ difference |
|---|---|---|---|---|---|
| 1 | Springfield, MA | $1,996 | $1,734 | 15.1% | $262 |
| 2 | Milwaukee, WI | $1,536 | $1,338 | 14.8% | $198 |
| 3 | Wichita, KS | $1,256 | $1,099 | 14.3% | $157 |
| 4 | Omaha, NE | $1,548 | $1,368 | 13.2% | $180 |
| 5 | Baltimore, MD | $2,084 | $1,857 | 12.2% | $227 |
| 6 | Buffalo, NY | $1,494 | $1,343 | 11.2% | $151 |
| 7 | Syracuse, NY | $1,506 | $1,392 | 8.2% | $114 |
| 7 | Spokane, WA | $1,656 | $1,531 | 8.2% | $125 |
| 9 | Minneapolis, MN | $1,807 | $1,709 | 5.7% | $98 |
| 10 | Toledo, OH | $1,130 | $1,076 | 5.0% | $54 |
| 11 | Worcester, MA | $2,069 | $2,056 | 0.6% | $13 |
| 12 | Bakersfield, CA | $1,479 | $1,483 | -0.3% | -$4 |
| 13 | St. Louis, MO | $1,205 | $1,218 | -1.1% | -$13 |
| 14 | Rochester, NY | $1,546 | $1,573 | -1.7% | -$27 |
| 15 | Colorado Springs, CO | $1,680 | $1,735 | -3.2% | -$55 |
| 16 | Chicago, IL | $1,712 | $1,781 | -3.9% | -$69 |
| 17 | Indianapolis, IN | $1,409 | $1,473 | -4.3% | -$64 |
| 18 | Washington, DC | $2,140 | $2,253 | -5.0% | -$113 |
| 19 | Scranton, PA | $1,151 | $1,252 | -8.1% | -$101 |
| 20 | Akron, OH | $1,161 | $1,268 | -8.4% | -$107 |
| 21 | Cleveland, OH | $1,164 | $1,279 | -9.0% | -$115 |
| 22 | Madison, WI | $1,540 | $1,694 | -9.1% | -$154 |
| 23 | Albany, NY | $1,544 | $1,702 | -9.3% | -$158 |
| 23 | Dayton, OH | $1,154 | $1,273 | -9.3% | -$119 |
| 25 | Fresno, CA | $1,505 | $1,664 | -9.6% | -$159 |
| 26 | Pittsburgh, PA | $1,169 | $1,299 | -10.0% | -$130 |
| 27 | Stockton, CA | $1,554 | $1,742 | -10.8% | -$188 |
| 28 | Tucson, AZ | $1,241 | $1,402 | -11.5% | -$161 |
| 29 | Poughkeepsie, NY | $1,737 | $1,979 | -12.2% | -$242 |
| 30 | Denver, CO | $1,819 | $2,089 | -12.9% | -$270 |
| 31 | Cincinnati, OH | $1,177 | $1,353 | -13.0% | -$176 |
| 32 | Louisville, KY | $1,103 | $1,272 | -13.3% | -$169 |
| 33 | Portland, OR | $1,654 | $1,922 | -13.9% | -$268 |
| 34 | Kansas City, MO | $1,167 | $1,358 | -14.1% | -$191 |
| 35 | Memphis, TN | $1,093 | $1,274 | -14.2% | -$181 |
| 36 | Des Moines, IA | $1,104 | $1,318 | -16.2% | -$214 |
| 37 | Detroit, MI | $1,167 | $1,411 | -17.3% | -$244 |
| 37 | Columbus, OH | $1,182 | $1,430 | -17.3% | -$248 |
| 39 | Richmond, VA | $1,361 | $1,655 | -17.8% | -$294 |
| 40 | Hartford, CT | $1,524 | $1,865 | -18.3% | -$341 |
| 41 | Winston-Salem, NC | $1,001 | $1,232 | -18.8% | -$231 |
| 42 | Providence, RI | $1,401 | $1,729 | -19.0% | -$328 |
| 43 | Provo, UT | $1,180 | $1,460 | -19.2% | -$280 |
| 44 | Harrisburg, PA | $1,195 | $1,493 | -20.0% | -$298 |
| 45 | Albuquerque, NM | $1,159 | $1,464 | -20.8% | -$305 |
| 46 | Virginia Beach, VA | $1,353 | $1,713 | -21.0% | -$360 |
| 47 | New Haven, CT | $1,538 | $1,969 | -21.9% | -$431 |
| 48 | Honolulu, HI | $2,040 | $2,642 | -22.8% | -$602 |
| 49 | Boston, MA | $2,263 | $2,941 | -23.1% | -$678 |
| 50 | Greensboro, NC | $1,015 | $1,330 | -23.7% | -$315 |
| 50 | McAllen, TX | $809 | $1,060 | -23.7% | -$251 |
| 52 | Phoenix, AZ | $1,389 | $1,839 | -24.5% | -$450 |
| 53 | Tulsa, OK | $913 | $1,217 | -25.0% | -$304 |
| 54 | Allentown, PA | $1,219 | $1,634 | -25.4% | -$415 |
| 54 | Knoxville, TN | $1,097 | $1,471 | -25.4% | -$374 |
| 54 | Oklahoma City, OK | $928 | $1,244 | -25.4% | -$316 |
| 57 | Seattle, WA | $1,852 | $2,501 | -25.9% | -$649 |
| 58 | Grand Rapids, MI | $1,133 | $1,531 | -26.0% | -$398 |
| 59 | Ogden, UT | $1,182 | $1,614 | -26.8% | -$432 |
| 60 | Baton Rouge, LA | $865 | $1,204 | -28.2% | -$339 |
| 61 | El Paso, TX | $853 | $1,191 | -28.4% | -$338 |
| 62 | Riverside, CA | $1,562 | $2,201 | -29.0% | -$639 |
| 63 | Philadelphia, PA | $1,282 | $1,810 | -29.2% | -$528 |
| 64 | Sacramento, CA | $1,576 | $2,255 | -30.1% | -$679 |
| 65 | Augusta, GA | $868 | $1,261 | -31.2% | -$393 |
| 66 | Little Rock, AR | $788 | $1,147 | -31.3% | -$359 |
| 67 | Salt Lake City, UT | $1,197 | $1,747 | -31.5% | -$550 |
| 68 | Columbia, SC | $871 | $1,276 | -31.7% | -$405 |
| 69 | Nashville, TN | $1,152 | $1,730 | -33.4% | -$578 |
| 70 | Lakeland, FL | $991 | $1,497 | -33.8% | -$506 |
| 71 | New Orleans, LA | $868 | $1,331 | -34.8% | -$463 |
| 72 | Greenville, SC | $869 | $1,339 | -35.1% | -$470 |
| 73 | Los Angeles, CA | $1,671 | $2,601 | -35.8% | -$930 |
| 74 | Bridgeport, CT | $1,583 | $2,511 | -37.0% | -$928 |
| 74 | Charlotte, NC | $1,062 | $1,686 | -37.0% | -$624 |
| 76 | San Antonio, TX | $886 | $1,426 | -37.9% | -$540 |
| 77 | Durham, NC | $1,058 | $1,711 | -38.2% | -$653 |
| 78 | Raleigh, NC | $1,073 | $1,750 | -38.7% | -$677 |
| 79 | New York, NY | $1,780 | $2,910 | -38.8% | -$1,130 |
| 80 | Las Vegas, NV | $1,060 | $1,735 | -38.9% | -$675 |
| 81 | Oxnard, CA | $1,642 | $2,693 | -39.0% | -$1,051 |
| 82 | Jacksonville, FL | $1,010 | $1,658 | -39.1% | -$648 |
| 83 | Houston, TX | $947 | $1,573 | -39.8% | -$626 |
| 84 | Palm Bay, FL | $1,027 | $1,709 | -39.9% | -$682 |
| 85 | Birmingham, AL | $752 | $1,266 | -40.6% | -$514 |
| 86 | Deltona, FL | $1,005 | $1,700 | -40.9% | -$695 |
| 87 | Jackson, MS | $709 | $1,288 | -45.0% | -$579 |
| 88 | Boise, ID | $903 | $1,655 | -45.4% | -$752 |
| 89 | North Port, FL | $1,055 | $1,958 | -46.1% | -$903 |
| 90 | San Diego, CA | $1,613 | $3,001 | -46.3% | -$1,388 |
| 91 | Tampa, FL | $1,053 | $1,977 | -46.7% | -$924 |
| 92 | Cape Coral, FL | $1,044 | $1,961 | -46.8% | -$917 |
| 93 | Atlanta, GA | $963 | $1,820 | -47.1% | -$857 |
| 94 | Charleston, SC | $943 | $1,787 | -47.2% | -$844 |
| 95 | Orlando, FL | $1,029 | $1,972 | -47.8% | -$943 |
| 96 | Dallas, TX | $977 | $1,931 | -49.4% | -$954 |
| 97 | Austin, TX | $923 | $1,852 | -50.2% | -$929 |
| 98 | San Francisco, CA | $1,711 | $3,604 | -52.5% | -$1,893 |
| 99 | San Jose, CA | $1,633 | $3,483 | -53.1% | -$1,850 |
| 100 | Miami, FL | $1,139 | $2,436 | -53.2% | -$1,297 |
Child care for 2 kids exceeds monthly rent in most metros
Understandably, the cost of child care for an infant and a 4-year-old exceeds monthly rent in significantly more metros — 85 of the 100 analyzed. For five, child care costs are at least twice the average rent.
Omaha, Neb., is first, with child care for an infant and a 4-year-old costing $2,891. Compared to the $1,368 monthly rent, child care costs 111.3% more. Milwaukee (110.9%) and Buffalo, N.Y. (105.6%), are also at the top.
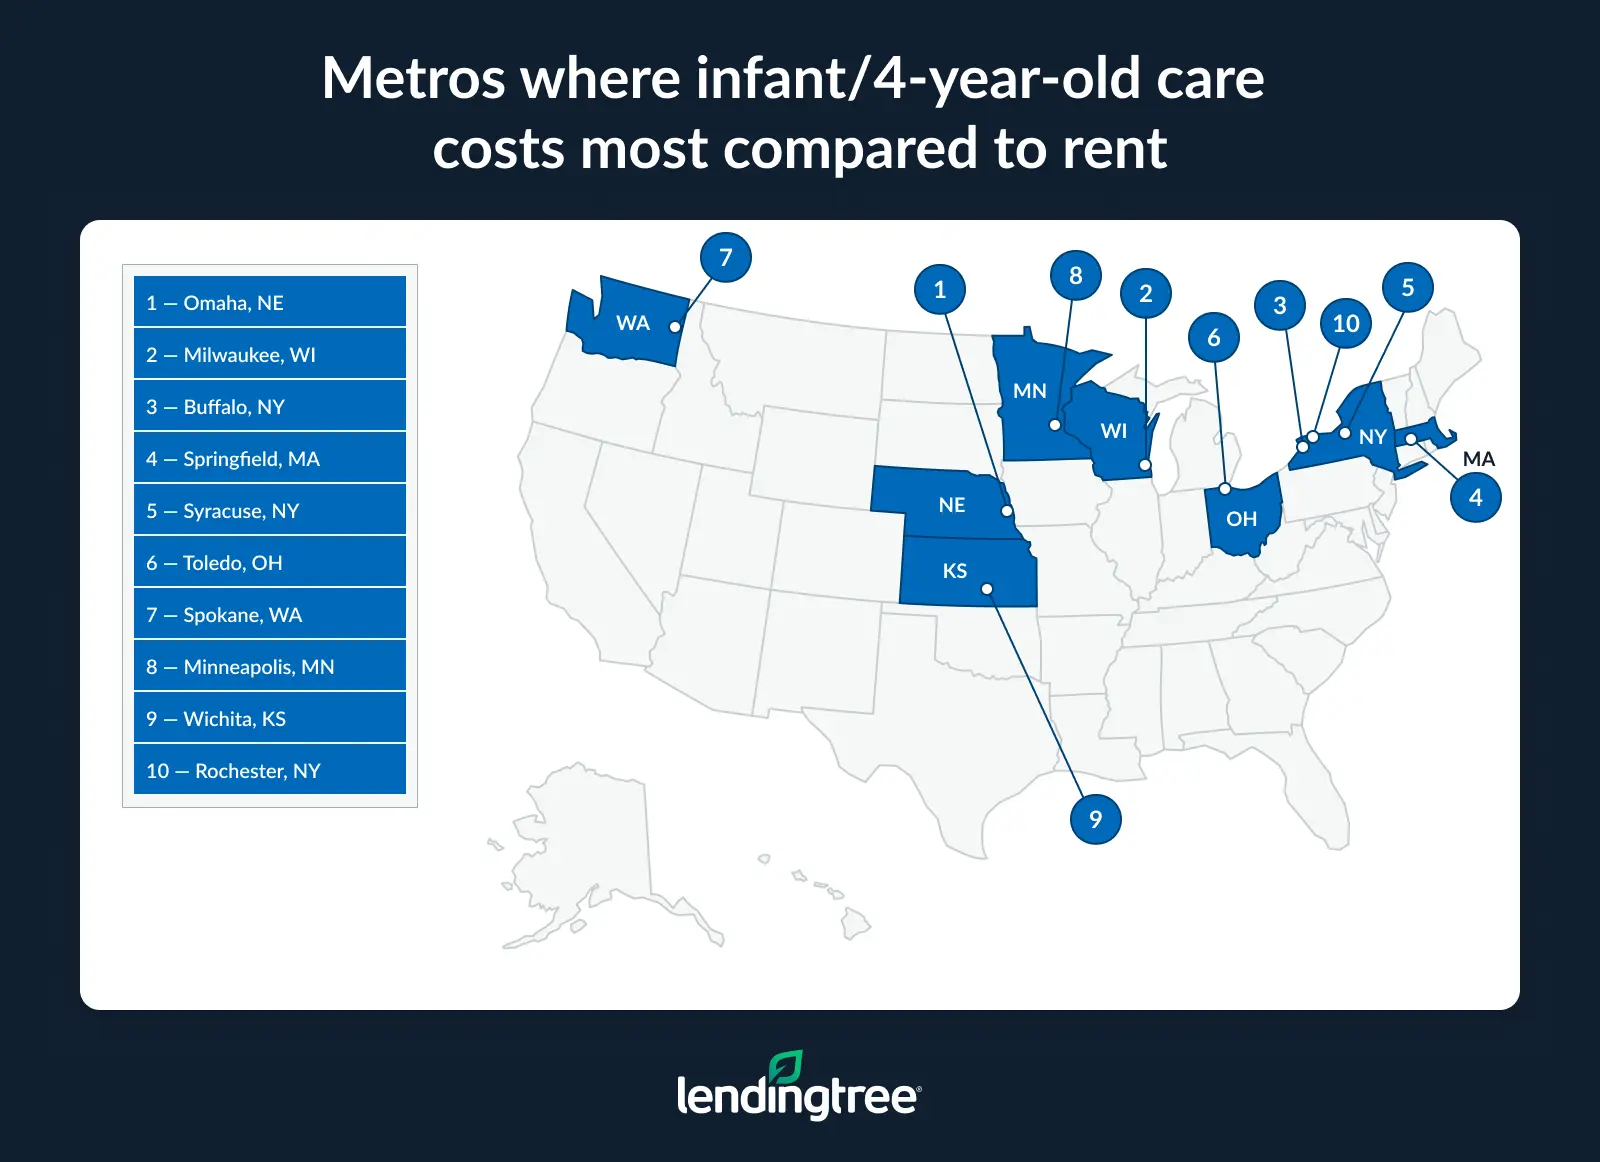
The other metros where child care costs are at least double the average rent are Springfield (105.4%) and Syracuse, N.Y. (100.0%). When we conducted this study last year, Springfield ranked first, with child care for two costing 135.7% more than rent.
According to Schulz, it can be difficult to navigate these high costs without cutting back on necessities.
“Knocking down your debt to free up more funds to put toward child care could be massive,” he says. “A 0% balance transfer credit card can be about your best weapon in the battle against credit card debt because it can dramatically reduce the amount of interest you pay on the debt. Consolidating your debts with a personal loan can help, too. You can even call your card issuer and ask for a lower interest rate. It works far more often than you’d imagine.”
Child care is cheaper than rent in some costly metros
Conversely, child care costs for two kids are less expensive than rent in 15 metros. Notably, California and Florida metros occupy the bottom 10 spots.
San Jose leads here, with rent costing $3,483 and child care costing $2,146 — meaning child care costs 38.4% less than rent. San Francisco (37.6%) and San Diego (29.4%) rank second and third, respectively.

In total, six of the bottom 10 metros are in California, with Oxnard, Los Angeles and Sacramento joining those mentioned above. The remaining four are in Florida: Miami, Orlando, Cape Coral and Tampa.
Full rankings: Metros where infant and 4-year-old care costs most/least compared to rent
| Rank | Metro | Avg. monthly child care cost for 2 kids | Avg. monthly 2-bedroom rent | % difference | $ difference |
|---|---|---|---|---|---|
| 1 | Omaha, NE | $2,891 | $1,368 | 111.3% | $1,523 |
| 2 | Milwaukee, WI | $2,822 | $1,338 | 110.9% | $1,484 |
| 3 | Buffalo, NY | $2,761 | $1,343 | 105.6% | $1,418 |
| 4 | Springfield, MA | $3,562 | $1,734 | 105.4% | $1,828 |
| 5 | Syracuse, NY | $2,784 | $1,392 | 100.0% | $1,392 |
| 6 | Toledo, OH | $2,094 | $1,076 | 94.6% | $1,018 |
| 7 | Spokane, WA | $2,967 | $1,531 | 93.8% | $1,436 |
| 8 | Minneapolis, MN | $3,199 | $1,709 | 87.2% | $1,490 |
| 9 | Wichita, KS | $2,020 | $1,099 | 83.8% | $921 |
| 10 | Rochester, NY | $2,857 | $1,573 | 81.6% | $1,284 |
| 11 | Baltimore, MD | $3,368 | $1,857 | 81.4% | $1,511 |
| 12 | Chicago, IL | $3,203 | $1,781 | 79.8% | $1,422 |
| 13 | Worcester, MA | $3,692 | $2,056 | 79.6% | $1,636 |
| 14 | Washington, DC | $3,854 | $2,253 | 71.1% | $1,601 |
| 15 | Akron, OH | $2,151 | $1,268 | 69.6% | $883 |
| 16 | Scranton, PA | $2,112 | $1,252 | 68.7% | $860 |
| 17 | Cleveland, OH | $2,156 | $1,279 | 68.6% | $877 |
| 18 | Indianapolis, IN | $2,480 | $1,473 | 68.4% | $1,007 |
| 19 | Dayton, OH | $2,139 | $1,273 | 68.0% | $866 |
| 20 | Albany, NY | $2,855 | $1,702 | 67.7% | $1,153 |
| 20 | St. Louis, MO | $2,042 | $1,218 | 67.7% | $824 |
| 22 | Madison, WI | $2,830 | $1,694 | 67.1% | $1,136 |
| 23 | Pittsburgh, PA | $2,146 | $1,299 | 65.2% | $847 |
| 24 | Colorado Springs, CO | $2,865 | $1,735 | 65.1% | $1,130 |
| 25 | Poughkeepsie, NY | $3,210 | $1,979 | 62.2% | $1,231 |
| 26 | Cincinnati, OH | $2,181 | $1,353 | 61.2% | $828 |
| 27 | Louisville, KY | $2,031 | $1,272 | 59.7% | $759 |
| 28 | Detroit, MI | $2,229 | $1,411 | 58.0% | $818 |
| 29 | Memphis, TN | $1,995 | $1,274 | 56.6% | $721 |
| 30 | Tucson, AZ | $2,150 | $1,402 | 53.4% | $748 |
| 31 | Columbus, OH | $2,190 | $1,430 | 53.1% | $760 |
| 32 | Providence, RI | $2,612 | $1,729 | 51.1% | $883 |
| 33 | Des Moines, IA | $1,983 | $1,318 | 50.5% | $665 |
| 34 | Richmond, VA | $2,487 | $1,655 | 50.3% | $832 |
| 35 | Winston-Salem, NC | $1,841 | $1,232 | 49.4% | $609 |
| 36 | Hartford, CT | $2,785 | $1,865 | 49.3% | $920 |
| 37 | Denver, CO | $3,102 | $2,089 | 48.5% | $1,013 |
| 38 | Harrisburg, PA | $2,193 | $1,493 | 46.9% | $700 |
| 39 | Kansas City, MO | $1,978 | $1,358 | 45.7% | $620 |
| 40 | McAllen, TX | $1,538 | $1,060 | 45.1% | $478 |
| 41 | Portland, OR | $2,779 | $1,922 | 44.6% | $857 |
| 42 | Virginia Beach, VA | $2,471 | $1,713 | 44.2% | $758 |
| 43 | New Haven, CT | $2,811 | $1,969 | 42.8% | $842 |
| 44 | Grand Rapids, MI | $2,165 | $1,531 | 41.4% | $634 |
| 45 | Greensboro, NC | $1,867 | $1,330 | 40.4% | $537 |
| 46 | Tulsa, OK | $1,708 | $1,217 | 40.3% | $491 |
| 47 | Oklahoma City, OK | $1,737 | $1,244 | 39.6% | $493 |
| 48 | Boston, MA | $4,038 | $2,941 | 37.3% | $1,097 |
| 49 | Provo, UT | $2,003 | $1,460 | 37.2% | $543 |
| 49 | Baton Rouge, LA | $1,652 | $1,204 | 37.2% | $448 |
| 51 | Allentown, PA | $2,236 | $1,634 | 36.8% | $602 |
| 52 | Knoxville, TN | $2,003 | $1,471 | 36.2% | $532 |
| 52 | El Paso, TX | $1,622 | $1,191 | 36.2% | $431 |
| 54 | Albuquerque, NM | $1,972 | $1,464 | 34.7% | $508 |
| 55 | Seattle, WA | $3,318 | $2,501 | 32.7% | $817 |
| 56 | Columbia, SC | $1,676 | $1,276 | 31.3% | $400 |
| 57 | Bakersfield, CA | $1,944 | $1,483 | 31.1% | $461 |
| 58 | Little Rock, AR | $1,502 | $1,147 | 31.0% | $355 |
| 59 | Phoenix, AZ | $2,404 | $1,839 | 30.7% | $565 |
| 60 | Philadelphia, PA | $2,352 | $1,810 | 29.9% | $542 |
| 61 | Augusta, GA | $1,619 | $1,261 | 28.4% | $358 |
| 62 | Greenville, SC | $1,673 | $1,339 | 24.9% | $334 |
| 63 | New Orleans, LA | $1,658 | $1,331 | 24.6% | $327 |
| 64 | Ogden, UT | $2,006 | $1,614 | 24.3% | $392 |
| 65 | Honolulu, HI | $3,223 | $2,642 | 22.0% | $581 |
| 66 | Nashville, TN | $2,103 | $1,730 | 21.6% | $373 |
| 67 | Fresno, CA | $1,977 | $1,664 | 18.8% | $313 |
| 68 | San Antonio, TX | $1,684 | $1,426 | 18.1% | $258 |
| 69 | Stockton, CA | $2,043 | $1,742 | 17.3% | $301 |
| 70 | Salt Lake City, UT | $2,033 | $1,747 | 16.4% | $286 |
| 71 | Charlotte, NC | $1,953 | $1,686 | 15.8% | $267 |
| 72 | Bridgeport, CT | $2,892 | $2,511 | 15.2% | $381 |
| 73 | Birmingham, AL | $1,454 | $1,266 | 14.8% | $188 |
| 74 | Houston, TX | $1,801 | $1,573 | 14.5% | $228 |
| 75 | Lakeland, FL | $1,708 | $1,497 | 14.1% | $211 |
| 76 | Durham, NC | $1,946 | $1,711 | 13.7% | $235 |
| 77 | New York, NY | $3,290 | $2,910 | 13.1% | $380 |
| 78 | Raleigh, NC | $1,973 | $1,750 | 12.7% | $223 |
| 79 | Las Vegas, NV | $1,947 | $1,735 | 12.2% | $212 |
| 80 | Jacksonville, FL | $1,741 | $1,658 | 5.0% | $83 |
| 81 | Jackson, MS | $1,341 | $1,288 | 4.1% | $53 |
| 82 | Palm Bay, FL | $1,769 | $1,709 | 3.5% | $60 |
| 83 | Deltona, FL | $1,732 | $1,700 | 1.9% | $32 |
| 83 | Boise, ID | $1,687 | $1,655 | 1.9% | $32 |
| 85 | Charleston, SC | $1,815 | $1,787 | 1.6% | $28 |
| 86 | Atlanta, GA | $1,795 | $1,820 | -1.4% | -$25 |
| 87 | Dallas, TX | $1,856 | $1,931 | -3.9% | -$75 |
| 88 | Austin, TX | $1,754 | $1,852 | -5.3% | -$98 |
| 89 | Riverside, CA | $2,052 | $2,201 | -6.8% | -$149 |
| 90 | North Port, FL | $1,818 | $1,958 | -7.2% | -$140 |
| 91 | Sacramento, CA | $2,070 | $2,255 | -8.2% | -$185 |
| 91 | Tampa, FL | $1,815 | $1,977 | -8.2% | -$162 |
| 93 | Cape Coral, FL | $1,799 | $1,961 | -8.3% | -$162 |
| 94 | Orlando, FL | $1,774 | $1,972 | -10.0% | -$198 |
| 95 | Los Angeles, CA | $2,195 | $2,601 | -15.6% | -$406 |
| 96 | Miami, FL | $1,962 | $2,436 | -19.5% | -$474 |
| 97 | Oxnard, CA | $2,158 | $2,693 | -19.9% | -$535 |
| 98 | San Diego, CA | $2,120 | $3,001 | -29.4% | -$881 |
| 99 | San Francisco, CA | $2,248 | $3,604 | -37.6% | -$1,356 |
| 100 | San Jose, CA | $2,146 | $3,483 | -38.4% | -$1,337 |
Raising a child in major metro: Top expert tips
Being a parent who rents in a large metro is understandably tough, but you don’t have to drown in debt to make it work. We offer the following advice:
- Seek financial help from the government and other organizations. “For those struggling the most with child care, help is available,” Schulz says. “Seek local, state and federal government agencies geared toward helping financially strapped parents, but also consider religious organizations and other nonprofits. It can be tough to swallow your pride to reach out for help, but you can do it if it’s important enough to your family.”
- Consider a personal loan to help in a pinch. “Taking on extra debt may seem like the last thing to do when you’re struggling with child care costs, but it may be helpful,” he says. “That’s especially true if you expect your financial hardship to be temporary, due to a job loss, medical emergency or unforeseen event. A personal loan can help make things easier. You can even use one to consolidate loans, ideally reducing your interest rates. Just make sure you shop around. Loan offers can vary widely by lender, but you won’t be able to see that unless you take the time to comparison shop.”
- Remember your end goal. “High rent and child care costs create massive challenges for most young families,” he says. “However, to the degree possible, it’s important to not fully ignore long-term goals like retirement, emergency funds and college savings. That’s because the most powerful financial asset anyone has is time. The earlier you build the habit of saving and investing, the better you’ll be in the long run. Even if that savings is just a few dollars in each paycheck, the long-term returns can be massive when done consistently.”
Methodology
LendingTree researchers used 2024 Child Care Aware of America data to calculate average full-time center-based child care costs for one infant and two kids (an infant and a 4-year-old) in the 100 largest U.S. metros.
Researchers determined child care costs in the 100 metros by adjusting state costs to the 2023 metropolitan area regional price parity (RPP) for all items via the U.S. Bureau of Economic Analysis (BEA). This adjustment was done using the state RPP as the base for our calculation.
Then, child care costs were compared to the cost of renting a two-bedroom housing unit in each metro based on fiscal-year 2026 Fair Market Rents (FMRs) data via the U.S. Department of Housing and Urban Development (HUD). We also calculated two-bedroom rent and child care averages across the 100 metros.
FMRs are estimates of the amount required to cover gross rents (rent and utility expenses) for 40% of the rental housing units in a given area. These estimates are crucial for several HUD programs, including setting the maximum amount covered by Housing Choice Vouchers.
Get debt consolidation loan offers from up to 5 lenders in minutes