It Costs an Additional $303,418 to Raise a Child Over 18 Years, Up 1.9%
The cost of raising a child over 18 years is up again, now topping $300,000 for the first time since we began tracking it in 2023.
However, there’s some good news: Costs during the first five years have decreased, powered primarily by a small drop in day care costs.
Here’s what else we found.
Our research highlights the costs of raising a child — specifically, the additional costs that impact parents. That includes a mix of child-specific expenses (like day care) and regular household expenses that raising a child can impact (like rent).
As an example, we incorporate full child care costs since that’s an additional cost of raising a small child. However, for expenses like rent, we only tally the cost difference between households with and without children to show the true impact.
The majority of our data is from 2024 due to availability, but our national food and day care data, as well as our info on tax exemptions or credits, is newer. Here’s a look at the categories and how they were calculated:
- Rent: The difference in average rent paid between households without children and households with a child younger than 18 present in the household. This is calculated by state. (U.S. Census Bureau 2024 American Community Survey — ACS — with one-year estimates)
- Food: The difference in typical food spending between a two-person household and a two-person household with a child. We used different sources by state and nationally because of data availability. (State: Massachusetts Institute of Technology — MIT — Living Wage Calculator, retrieved in February 2026; national: U.S. Bureau of Labor Statistics — BLS — Consumer Expenditure Surveys, 2024)
- Day care: At the state level, data is based on the annual price of full-time center-based child care for one infant. Nationally, it’s the average child care cost for one infant at a day care center. We used different sources by state and nationally because of data availability. (State: Price of Care: 2024 report from Child Care Aware of America; national: Care.com 2026 Cost of Care Report)
- Apparel: The average amount married couples with children spend each year on apparel for girls ages 2 to 15. Researchers chose girls’ clothing due to typically higher spending compared to boys’ clothes. (U.S. BLS Consumer Expenditure Surveys, 2024; U.S. Bureau of Economic Analysis — BEA — regional price parities were used to calculate state estimates)
- Transportation: The difference in typical transportation spending between a two-person household and a two-person household with a child. This is calculated by state. We used different sources by state and nationally because of data availability. (State: MIT Living Wage Calculator, retrieved in February 2026; national: U.S. BLS Consumer Expenditure Surveys, 2024)
- Health insurance premiums: The difference in the average annual cost of premiums for a single person on workplace insurance (times two for two adults) compared to a single workplace-based family plan. (KFF, 2024)
- State tax exemptions or credits: This assumes that two parents filing jointly (married) earn the national median income for families. For exemptions, the amount subtracted is the exemption amount multiplied by the marginal tax rate for that national median income. For credits, the dollar amount of the credit is applied. (Tax Foundation and IRS, 2025)
- The 18-year cost of raising a child grew to $303,418 after tax exemptions and credits, according to a LendingTree analysis, even though the cost of the first five years dipped slightly. That’s an average of $16,857 annually over 18 years, up 1.9% from a year ago. However, annual costs in the first five years decreased slightly from $29,419 to $29,325 (or 0.3%), driven primarily by a dip in day care costs.
- Hawaii is the most expensive state to raise a small child, with annual costs for the first five years reaching $40,342. Maryland and Massachusetts follow at $36,419 and $34,247. Conversely, annual costs are lowest in Mississippi ($17,148), Alabama ($18,019) and South Dakota ($18,622). All three states have infant day care costs below $10,000 annually, helping them rank among the cheapest states to raise a small child.
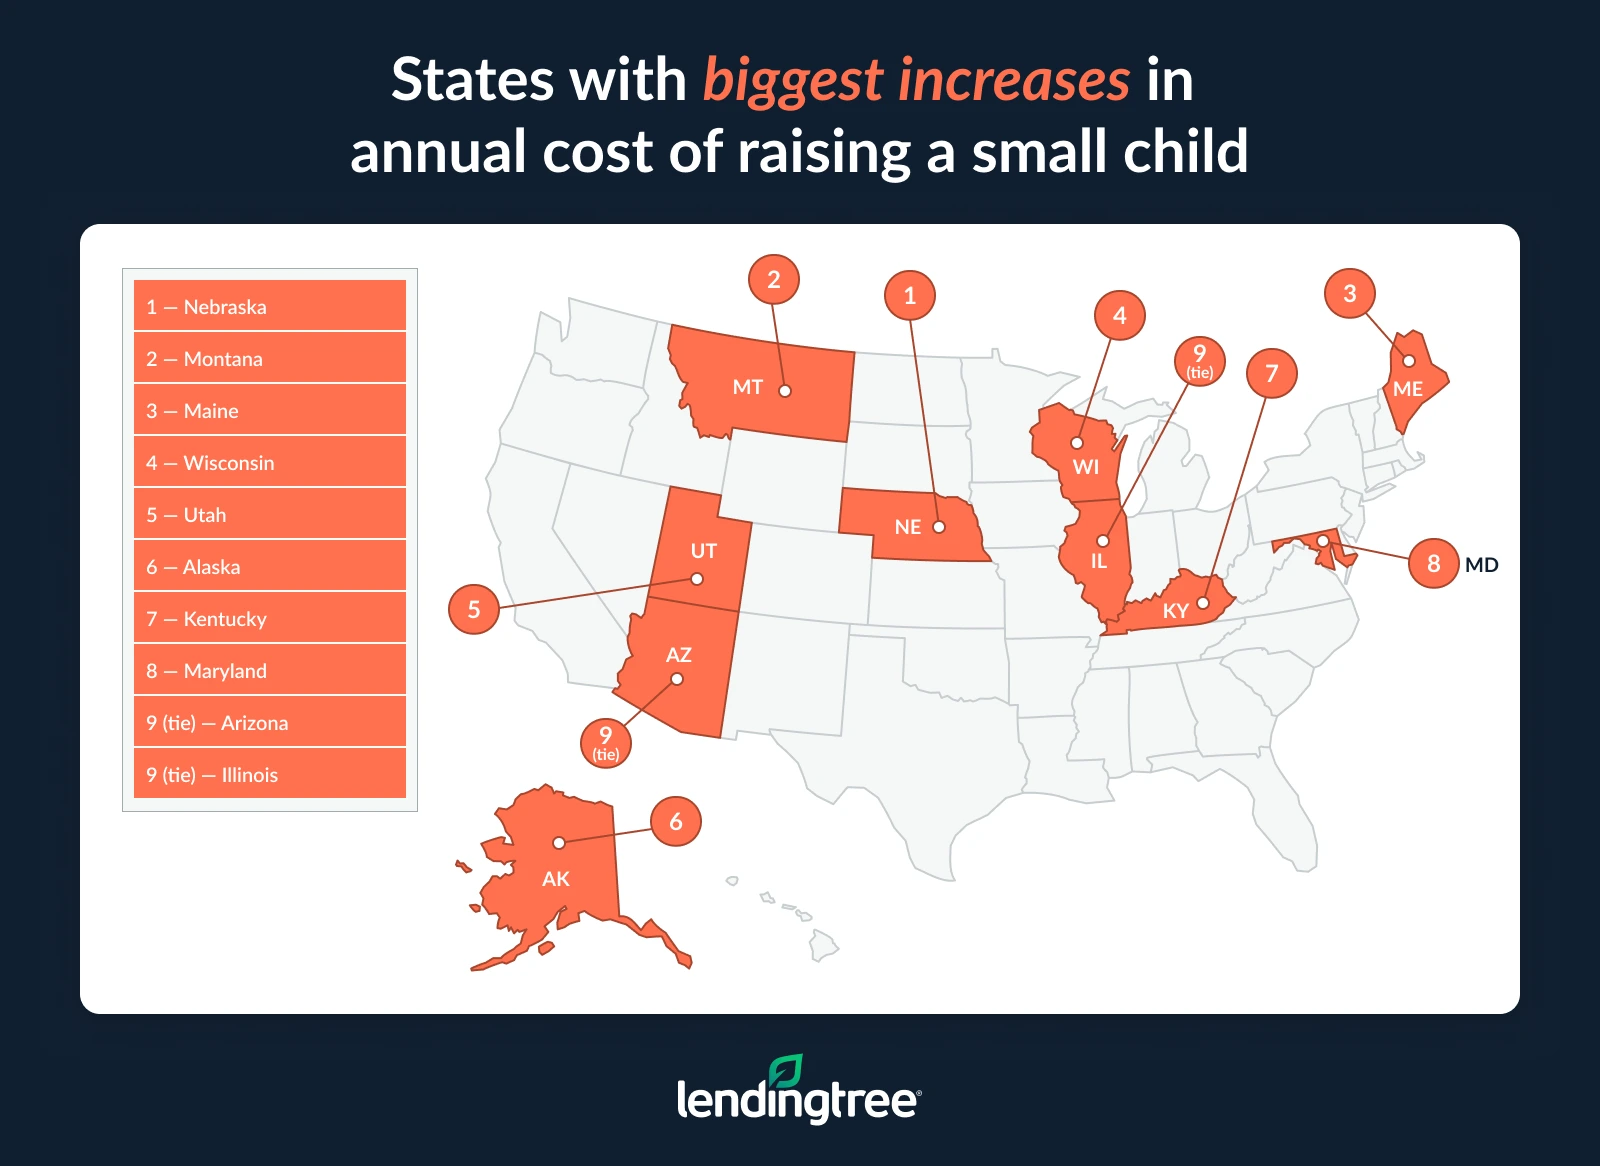
- Fourteen states saw the annual cost of raising a small child rise at least 10.0%, including four with growth of 20.0% or more. Annual costs rose in 39 states and the District of Columbia. Nebraska (27.4%), Montana (24.5%), Maine (24.4%) and Wisconsin (23.3%) all saw significant year-over-year growth in the annual cost of raising a small kid.
- Families in six states are projected to spend more than $300,000 raising a child over 18 years, with Hawaii leading at $412,661, followed by Alaska ($365,047) and Maryland ($326,360). By contrast, projected costs are lowest in New Hampshire ($201,963), the District of Columbia ($202,115) and South Carolina ($204,213). Kansas and Alaska saw the largest increases in projected 18-year child-rearing costs, each rising 23.5% from last year’s report.
- Families spend an average of 21.9% of their income on the basic annual expenses to raise a small child, down from 22.6% in our 2025 analysis. The percentage is lowest in the District of Columbia (13.9%) and highest in Hawaii (27.4%).
18-year cost of raising a kid tops $300,000
Our 2026 report, which primarily includes data from 2024, finds that expenses associated with raising a child for 18 years add up to $303,418, up 1.9% from $297,674 in last year’s report, which primarily used data from 2023.
That $303,418 averages out to $16,857 annually over 18 years. However, the annual costs for the first five years of a child’s life decreased slightly, dipping from $29,419 to $29,325 (or 0.3%), driven primarily by a small drop in the cost of day care. Day care costs fell by $572 annually (or 3.2%) from 2025’s report to 2026’s, the only cost to fall by more than a fraction of a percentage point.
Here’s a breakdown of the costs we included in our analysis.
Bare-bones cost of raising a child in the U.S. (2025 report vs. 2026 report)
| Category | Cost, 2026 report | Cost, 2025 report | Difference ($) | Difference (%) |
|---|---|---|---|---|
| Rent | $1,680 | $1,128 | $552 | 48.9% |
| Food | $4,208 | $4,216 | -$8 | -0.2% |
| Infant day care | $17,264 | $17,836 | -$572 | -3.2% |
| Girls’ apparel | $313 | $247 | $66 | 26.7% |
| Transportation | $4,422 | $4,383 | $39 | 0.9% |
| Insurance premiums | $3,638 | $3,609 | $29 | 0.8% |
| Value of federal tax credit | -$2,200 | -$2,000 | -$200 | 10.0% |
| Annual cost for first 5 years | $29,325 | $29,419 | -$94 | -0.3% |
| Annual cost for next 13 years | $12,061 | $11,583 | $478 | 4.1% |
| Avg. annual cost over 18 years | $16,857 | $16,537 | $320 | 1.9% |
| Total cost over 18 years | $303,418 | $297,674 | $5,744 | 1.9% |
In most cases, the above numbers represent a dramatic slowdown in the cost of raising a child, which is absolutely welcome news for parents. However, many may not feel like celebrating. Even with that slowdown, the overall 18-year cost of raising a child has risen 27.8% between our 2023 and 2026 reports that mostly assessed 2021 and 2024 data, and the annual cost for the first five years has increased by 35.3%.
Here’s how that breaks down.
Bare-bones cost of raising a child in the U.S. (2023 report vs. 2026 report)
| Category | Cost, 2026 report | Cost, 2023 report | Difference ($) | Difference (%) |
|---|---|---|---|---|
| Rent | $1,680 | $1,104 | $576 | 52.2% |
| Food | $4,208 | $3,254 | $954 | 29.3% |
| Infant day care | $17,264 | $11,752 | $5,512 | 46.9% |
| Girls’ apparel | $313 | $273 | $40 | 14.7% |
| Transportation | $4,422 | $6,010 | -$1,588 | -26.4% |
| Insurance premiums | $3,638 | $2,888 | $750 | 26.0% |
| Value of federal tax credit | -$2,200 | -$3,600 | $1,400 | -38.9% |
| Annual cost for first 5 years | $29,325 | $21,681 | $7,644 | 35.3% |
| Annual cost for next 13 years | $12,061 | $9,929 | $2,132 | 21.5% |
| Avg. annual cost over 18 years | $16,857 | $13,193 | $3,664 | 27.8% |
| Total cost over 18 years | $303,418 | $237,482 | $65,936 | 27.8% |
Hawaii is the most expensive state to raise a small child
Now, let’s dive deeper, starting with the first five years of a child’s life. Those years can be as overwhelming financially as they can be physically and emotionally. However, the costs of those early years can vary widely depending on where you live.
Parents in Hawaii face the highest costs, averaging $40,342 per year for those first five years. Maryland and Massachusetts are closest, at $36,419 and $34,247, respectively. Among the 10 states with the highest costs of raising a small child, only Colorado — ranking seventh at $31,000 annually — isn’t on the coast.
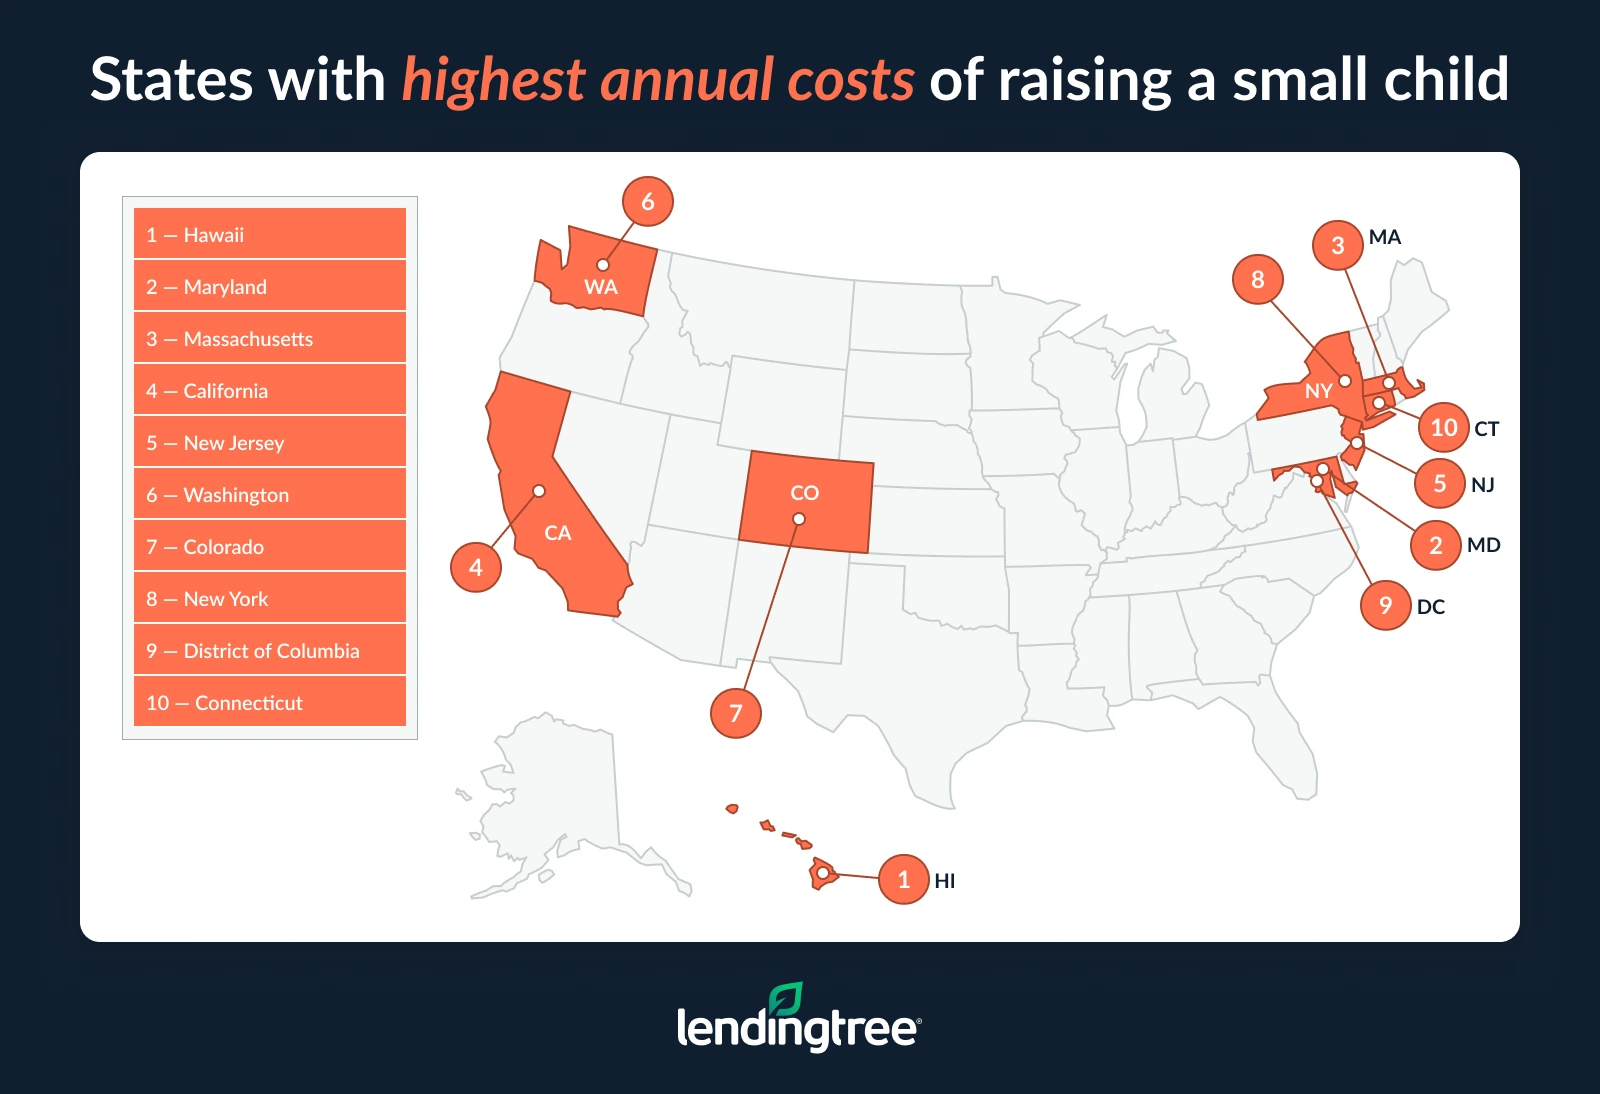
Conversely, annual costs for raising small children tend to be lowest in the South. Mississippi ($17,148) and Alabama ($18,019) have the lowest costs in the analyzed period. South Dakota ($18,622), the only non-Southern state among the seven lowest-cost states, ranks third.
Those three states all have infant day care costs below $10,000 annually, a key reason they rank among the most affordable states to raise a child. Arkansas, which ranked fifth-lowest at $19,204, was the only other state with infant day care costs below $10,000.
When looking just at the nation’s four most populous states — California, Texas, Florida and New York — we found large differences in cost. California ($33,692) ranks as the fourth most expensive state in the nation to raise a small child, while New York ranks eighth at $30,209. Meanwhile, Florida ranks 27th at $24,968, and Texas ranks 45th, with annual costs of just $20,968.
States with the highest/lowest annual costs of raising a small child (2026 report)
| Rank | State | Rent | Food | Infant day care | Girls’ apparel | Transportation | Insurance premiums | Value of exemption or credit | Total annual cost |
|---|---|---|---|---|---|---|---|---|---|
| 1 | Hawaii | $5,496 | $2,391 | $24,115 | $340 | $3,201 | $4,886 | -$87 | $40,342 |
| 2 | Maryland | $3,732 | $2,070 | $25,321 | $326 | $2,580 | $2,542 | -$152 | $36,419 |
| 3 | Massachusetts | -$684 | $2,185 | $26,343 | $339 | $2,457 | $3,657 | -$50 | $34,247 |
| 4 | California | $1,032 | $2,024 | $22,628 | $352 | $2,863 | $5,254 | -$461 | $33,692 |
| 5 | New Jersey | $3,372 | $2,068 | $20,213 | $341 | $2,456 | $3,581 | -$83 | $31,948 |
| 6 | Washington | $924 | $2,115 | $21,348 | $340 | $2,737 | $4,473 | $0 | $31,937 |
| 7 | Colorado | $1,488 | $2,045 | $20,978 | $317 | $2,557 | $3,615 | $0 | $31,000 |
| 8 | New York | $2,688 | $2,157 | $20,439 | $337 | $2,271 | $2,372 | -$55 | $30,209 |
| 9 | District of Columbia | -$4,140 | $2,432 | $26,193 | $347 | $1,421 | $3,893 | $0 | $30,146 |
| 10 | Connecticut | $3,072 | $2,057 | $18,492 | $325 | $2,687 | $3,041 | $0 | $29,674 |
| 11 | Nebraska | $3,408 | $1,875 | $18,147 | $283 | $2,864 | $3,085 | -$171 | $29,491 |
| 12 | Minnesota | $1,044 | $2,077 | $20,421 | $308 | $2,700 | $3,126 | -$354 | $29,322 |
| 13 | Alaska | $6,348 | $2,344 | $12,107 | $318 | $3,318 | $4,589 | $0 | $29,024 |
| 14 | Oregon | $960 | $2,096 | $19,500 | $328 | $2,641 | $3,118 | -$250 | $28,393 |
| 15 | Arizona | $3,624 | $1,834 | $15,964 | $316 | $2,611 | $3,668 | -$100 | $27,917 |
| 16 | Illinois | $360 | $1,986 | $19,807 | $310 | $2,495 | $3,090 | -$141 | $27,906 |
| 17 | Kansas | $3,960 | $1,904 | $15,156 | $282 | $2,812 | $3,809 | -$129 | $27,793 |
| 18 | Maine | $3,132 | $2,064 | $15,730 | $304 | $2,877 | $3,641 | -$300 | $27,448 |
| 19 | Montana | $2,196 | $1,952 | $15,080 | $282 | $2,952 | $4,758 | $0 | $27,220 |
| 20 | Wisconsin | $1,140 | $1,938 | $17,963 | $291 | $2,758 | $2,994 | -$37 | $27,047 |
| 21 | Rhode Island | $960 | $2,106 | $18,486 | $317 | $2,501 | $2,875 | -$242 | $27,003 |
| 22 | Virginia | $2,112 | $2,032 | $16,796 | $315 | $2,590 | $3,123 | -$53 | $26,915 |
| 23 | Indiana | $2,124 | $1,766 | $16,478 | $289 | $2,879 | $3,070 | -$30 | $26,576 |
| 24 | Vermont | -$360 | $2,175 | $18,710 | $302 | $2,933 | $2,835 | -$337 | $26,259 |
| 25 | Utah | $3,504 | $1,890 | $14,160 | $297 | $2,994 | $2,836 | -$93 | $25,588 |
| 26 | Delaware | $-516 | $1,956 | $16,617 | $311 | $2,736 | $4,114 | -$110 | $25,108 |
| 27 | Florida | $1,800 | $2,039 | $13,011 | $324 | $2,521 | $5,273 | $0 | $24,968 |
| 28 | Pennsylvania | $2,208 | $1,990 | $14,910 | $305 | $2,520 | $2,693 | $0 | $24,626 |
| 29 | Missouri | $3,216 | $1,918 | $13,780 | $287 | $2,747 | $2,525 | $0 | $24,473 |
| 30 | Wyoming | $2,160 | $1,940 | $12,784 | $284 | $3,197 | $3,424 | $0 | $23,789 |
| 31 | North Dakota | $3,468 | $1,885 | $12,299 | $277 | $2,992 | $2,357 | $0 | $23,278 |
| 32 | Idaho | $3,564 | $2,056 | $10,608 | $286 | $3,011 | $3,582 | $0 | $23,107 |
| 33 | New Hampshire | -$924 | $2,037 | $16,040 | $330 | $2,918 | $2,404 | $0 | $22,805 |
| 34 | Nevada | $2,184 | $1,912 | $12,659 | $304 | $2,830 | $2,862 | $0 | $22,751 |
| 35 | North Carolina | $1,116 | $1,925 | $12,370 | $295 | $2,658 | $4,348 | $0 | $22,712 |
| 36 | Michigan | $1,668 | $1,860 | $13,454 | $295 | $2,716 | $2,927 | -$247 | $22,673 |
| 37 | Tennessee | $264 | $1,970 | $13,126 | $290 | $2,802 | $4,093 | $0 | $22,545 |
| 38 | Ohio | $1,776 | $1,887 | $13,780 | $287 | $2,644 | $2,101 | -$66 | $22,409 |
| 39 | Kentucky | $1,452 | $1,759 | $12,740 | $283 | $2,846 | $3,017 | $0 | $22,097 |
| 40 | New Mexico | $1,392 | $1,825 | $13,521 | $283 | $2,672 | $2,404 | -$188 | $21,909 |
| 41 | West Virginia | $1,416 | $1,772 | $10,439 | $281 | $2,873 | $4,966 | -$96 | $21,651 |
| 42 | Louisiana | $936 | $1,859 | $10,847 | $276 | $2,837 | $4,548 | $0 | $21,303 |
| 43 | Oklahoma | $2,292 | $1,846 | $10,809 | $276 | $2,905 | $3,137 | -$48 | $21,218 |
| 44 | Iowa | $768 | $1,872 | $12,694 | $278 | $2,903 | $2,662 | -$40 | $21,137 |
| 45 | Texas | $1,068 | $1,718 | $11,349 | $304 | $2,708 | $3,821 | $0 | $20,968 |
| 46 | Georgia | $1,164 | $1,955 | $11,066 | $303 | $2,782 | $3,311 | -$216 | $20,365 |
| 47 | Arkansas | $2,184 | $1,771 | $9,178 | $271 | $2,861 | $2,968 | -$29 | $19,204 |
| 48 | South Carolina | -$432 | $1,862 | $10,474 | $292 | $2,835 | $4,176 | -$297 | $18,910 |
| 49 | South Dakota | $1,584 | $1,922 | $8,632 | $276 | $3,025 | $3,183 | $0 | $18,622 |
| 50 | Alabama | $816 | $1,923 | $8,632 | $282 | $2,908 | $3,958 | -$500 | $18,019 |
| 51 | Mississippi | $1,416 | $1,842 | $7,696 | $273 | $2,999 | $2,988 | -$66 | $17,148 |
Cost of raising a small child spiked by 10.0% or more in 14 states
From the 2025 to 2026 report (mainly analyzing 2023 and 2024 data), 39 states and the District of Columbia saw the annual cost of raising a small child jump. Fourteen states saw year-over-year increases of at least 10.0%, including four where costs spiked by at least 20.0%.
Nebraska (27.4%) saw the largest increase, followed by Montana (24.5%), Maine (24.4%) and Wisconsin (23.3%). The states with the biggest increases were spread throughout the country but tended to be more sparsely populated states.
Eleven states saw the annual cost of raising a small child dip from 2025’s report to 2026’s, though most of the decreases were smaller than 2.0%. The one glaring exception: New Hampshire, which saw costs fall by a stunning 19.5% year over year. North Dakota (9.9%) and Vermont (5.2%) were the only other states to see decreases of more than 5.0%.
States with the biggest year-over-year changes in the cost of raising a small child (2025 report vs. 2026 report)
| Rank | State | Cost, 2026 report | Cost, 2025 report | Difference (%) |
|---|---|---|---|---|
| 1 | Nebraska | $29,491 | $23,154 | 27.4% |
| 2 | Montana | $27,220 | $21,864 | 24.5% |
| 3 | Maine | $27,448 | $22,061 | 24.4% |
| 4 | Wisconsin | $27,047 | $21,930 | 23.3% |
| 5 | Utah | $25,588 | $21,784 | 17.5% |
| 6 | Alaska | $29,024 | $24,921 | 16.5% |
| 7 | Kentucky | $22,097 | $19,149 | 15.4% |
| 8 | Maryland | $36,419 | $31,601 | 15.2% |
| 9 | Arizona | $27,917 | $24,354 | 14.6% |
| 9 | Illinois | $27,906 | $24,343 | 14.6% |
| 11 | Kansas | $27,793 | $24,528 | 13.3% |
| 12 | California | $33,692 | $30,059 | 12.1% |
| 13 | Indiana | $26,576 | $23,786 | 11.7% |
| 14 | Hawaii | $40,342 | $36,472 | 10.6% |
| 15 | North Carolina | $22,712 | $20,818 | 9.1% |
| 16 | Oregon | $28,393 | $26,107 | 8.8% |
| 17 | West Virginia | $21,651 | $19,957 | 8.5% |
| 18 | New Jersey | $31,948 | $29,728 | 7.5% |
| 19 | Florida | $24,968 | $23,241 | 7.4% |
| 20 | Colorado | $31,000 | $28,922 | 7.2% |
| 21 | South Carolina | $18,910 | $17,699 | 6.8% |
| 22 | Georgia | $20,365 | $19,162 | 6.3% |
| 23 | Idaho | $23,107 | $21,797 | 6.0% |
| 24 | Pennsylvania | $24,626 | $23,270 | 5.8% |
| 24 | Ohio | $22,409 | $21,186 | 5.8% |
| 26 | Missouri | $24,473 | $23,201 | 5.5% |
| 26 | Delaware | $25,108 | $23,804 | 5.5% |
| 28 | Mississippi | $17,148 | $16,490 | 4.0% |
| 29 | Massachusetts | $34,247 | $33,004 | 3.8% |
| 30 | Michigan | $22,673 | $21,881 | 3.6% |
| 31 | District of Columbia | $30,146 | $29,186 | 3.3% |
| 31 | Rhode Island | $27,003 | $26,141 | 3.3% |
| 33 | Arkansas | $19,204 | $18,642 | 3.0% |
| 33 | New York | $30,209 | $29,327 | 3.0% |
| 35 | Connecticut | $29,674 | $28,899 | 2.7% |
| 36 | Oklahoma | $21,218 | $20,673 | 2.6% |
| 37 | Virginia | $26,915 | $26,666 | 0.9% |
| 38 | Alabama | $18,019 | $17,870 | 0.8% |
| 39 | Louisiana | $21,303 | $21,206 | 0.5% |
| 40 | Texas | $20,968 | $20,889 | 0.4% |
| 41 | Tennessee | $22,545 | $22,693 | -0.7% |
| 42 | Nevada | $22,751 | $23,063 | -1.4% |
| 43 | Washington | $31,937 | $32,418 | -1.5% |
| 44 | South Dakota | $18,622 | $18,918 | -1.6% |
| 45 | Minnesota | $29,322 | $29,891 | -1.9% |
| 45 | Wyoming | $23,789 | $24,262 | -1.9% |
| 47 | Iowa | $21,137 | $21,811 | -3.1% |
| 48 | New Mexico | $21,909 | $22,792 | -3.9% |
| 49 | Vermont | $26,259 | $27,690 | -5.2% |
| 50 | North Dakota | $23,278 | $25,834 | -9.9% |
| 51 | New Hampshire | $22,805 | $28,338 | -19.5% |
Families in 6 states are projected to spend more than $300,000 raising a child over 18 years
Now, let’s zoom out to look at costs over 18 years.
Hawaii is the most expensive state to raise a child to adulthood — by a wide margin. Raising a child for 18 years in Hawaii is projected to cost $412,661, nearly $50,000 more than the next most expensive state (Alaska at $365,047) and more than $85,000 more than the third-most expensive state, Maryland, at $326,360.
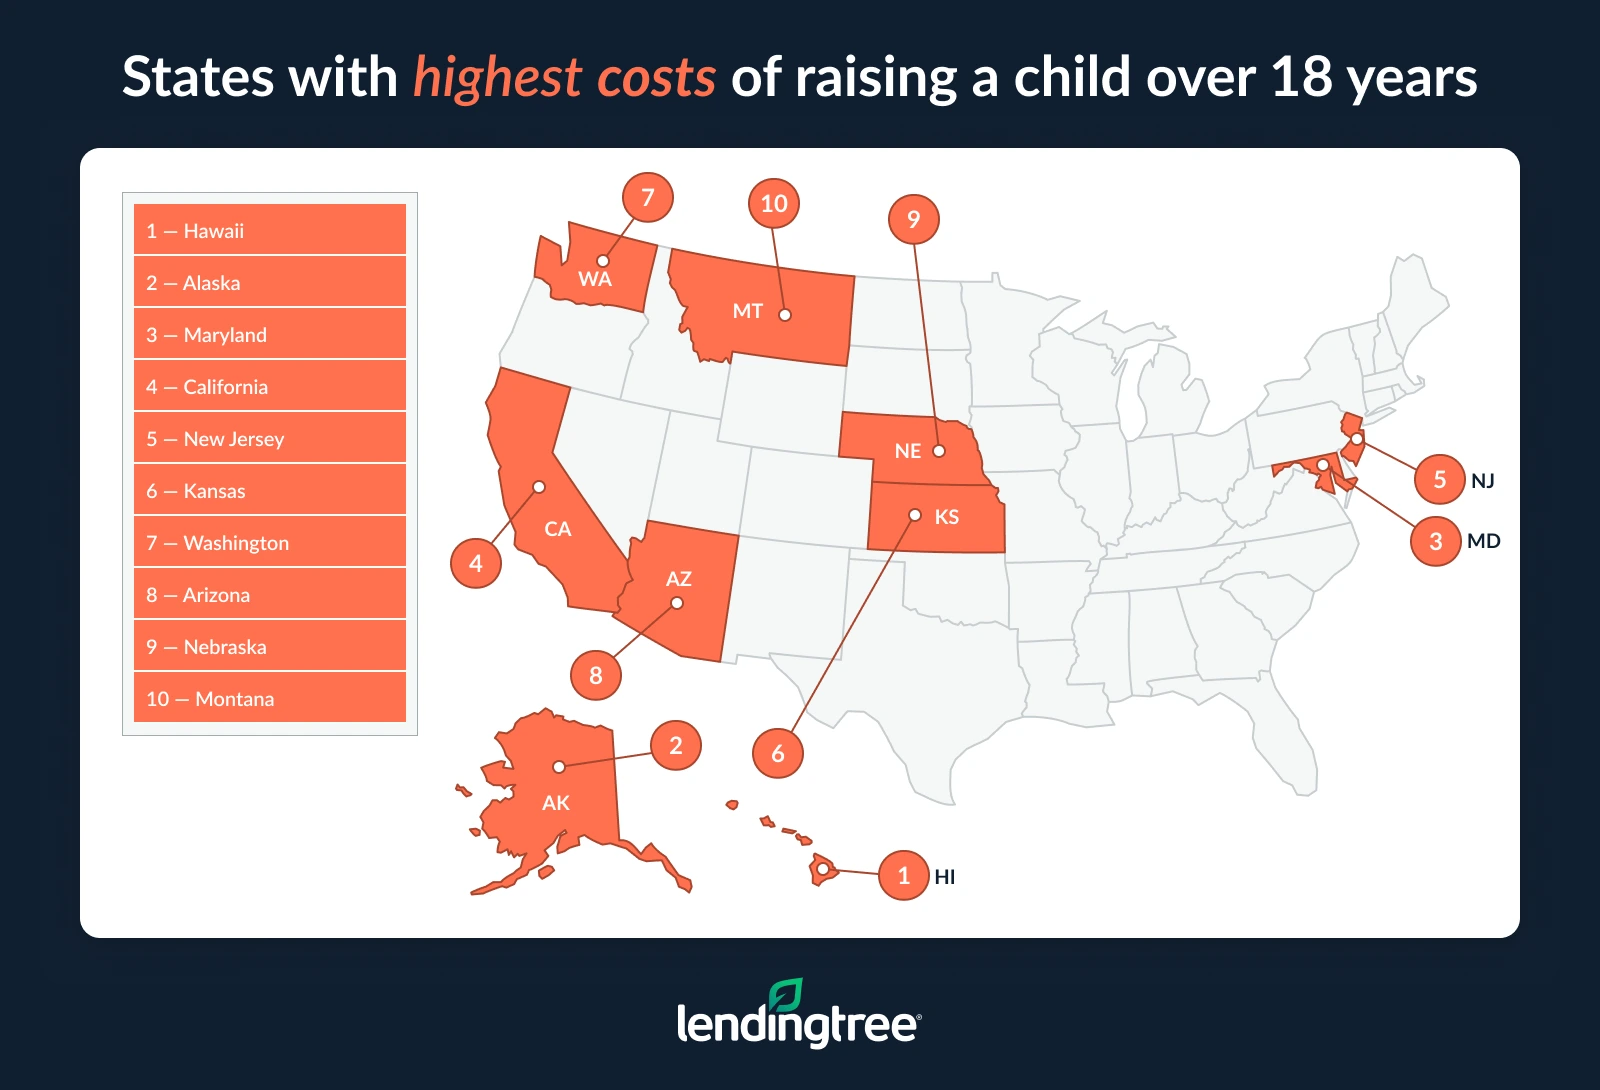
We saw massive differences in costs by state. For example, projected costs in New Hampshire ($201,963), the District of Columbia ($202,115) and South Carolina ($204,213) are less than half of what’s projected to be required in Hawaii. Two other states — Mississippi ($208,621) and Alabama ($212,121) — also have 18-year costs that are at least $200,000 lower than Hawaii.
Looking at the nation’s four most populous states, we again saw wide variations. California is the fourth-most expensive state in the nation at $312,300, while Florida ($280,280) and New York ($278,051) rank 14th and 15th, respectively. Texas is the least expensive of the four, coming in 39th at $229,891.
States with the highest/lowest costs of raising a child over 18 years (2026 report)
| Rank | State | Estimated cost |
|---|---|---|
| 1 | Hawaii | $412,661 |
| 2 | Alaska | $365,047 |
| 3 | Maryland | $326,360 |
| 4 | California | $312,300 |
| 5 | New Jersey | $312,295 |
| 6 | Kansas | $303,250 |
| 7 | Washington | $297,341 |
| 8 | Arizona | $294,982 |
| 9 | Nebraska | $294,926 |
| 10 | Montana | $293,926 |
| 11 | Connecticut | $293,728 |
| 12 | Maine | $289,573 |
| 13 | Colorado | $285,293 |
| 14 | Florida | $280,280 |
| 15 | New York | $278,051 |
| 16 | Idaho | $278,023 |
| 17 | Utah | $276,509 |
| 18 | Massachusetts | $273,981 |
| 19 | Virginia | $266,117 |
| 20 | Indiana | $264,147 |
| 21 | Minnesota | $262,330 |
| 22 | Wyoming | $262,014 |
| 23 | Missouri | $261,380 |
| 24 | North Dakota | $259,123 |
| 25 | Oregon | $257,569 |
| 26 | West Virginia | $254,005 |
| 27 | Wisconsin | $253,332 |
| 28 | Pennsylvania | $249,441 |
| 29 | North Carolina | $247,998 |
| 30 | Rhode Island | $245,738 |
| 31 | Nevada | $244,944 |
| 32 | Illinois | $244,826 |
| 33 | Louisiana | $242,450 |
| 34 | Oklahoma | $241,405 |
| 35 | Delaware | $235,920 |
| 36 | Tennessee | $235,164 |
| 37 | Michigan | $233,218 |
| 38 | Kentucky | $232,131 |
| 39 | Texas | $229,891 |
| 40 | Vermont | $229,428 |
| 41 | Arkansas | $226,354 |
| 42 | Ohio | $224,228 |
| 43 | South Dakota | $222,976 |
| 44 | Georgia | $222,713 |
| 45 | New Mexico | $218,588 |
| 46 | Iowa | $215,443 |
| 47 | Alabama | $212,121 |
| 48 | Mississippi | $208,621 |
| 49 | South Carolina | $204,213 |
| 50 | District of Columbia | $202,115 |
| 51 | New Hampshire | $201,963 |
18-year expenses jump the most in Kansas, Alaska
As if raising a child wasn’t already expensive enough, our analysis found that three states saw the 18-year costs of raising a child jump by more than 20.0% in a single year. That’s a significant strain on families, many of whom are already on tight budgets.
Kansas and Alaska both saw projected 18-year child-rearing costs rise 23.5% between our 2025 and 2026 analyses, while Montana wasn’t far behind with a 21.7% jump. Fourteen states overall saw year-over-year increases of at least 10.0%.
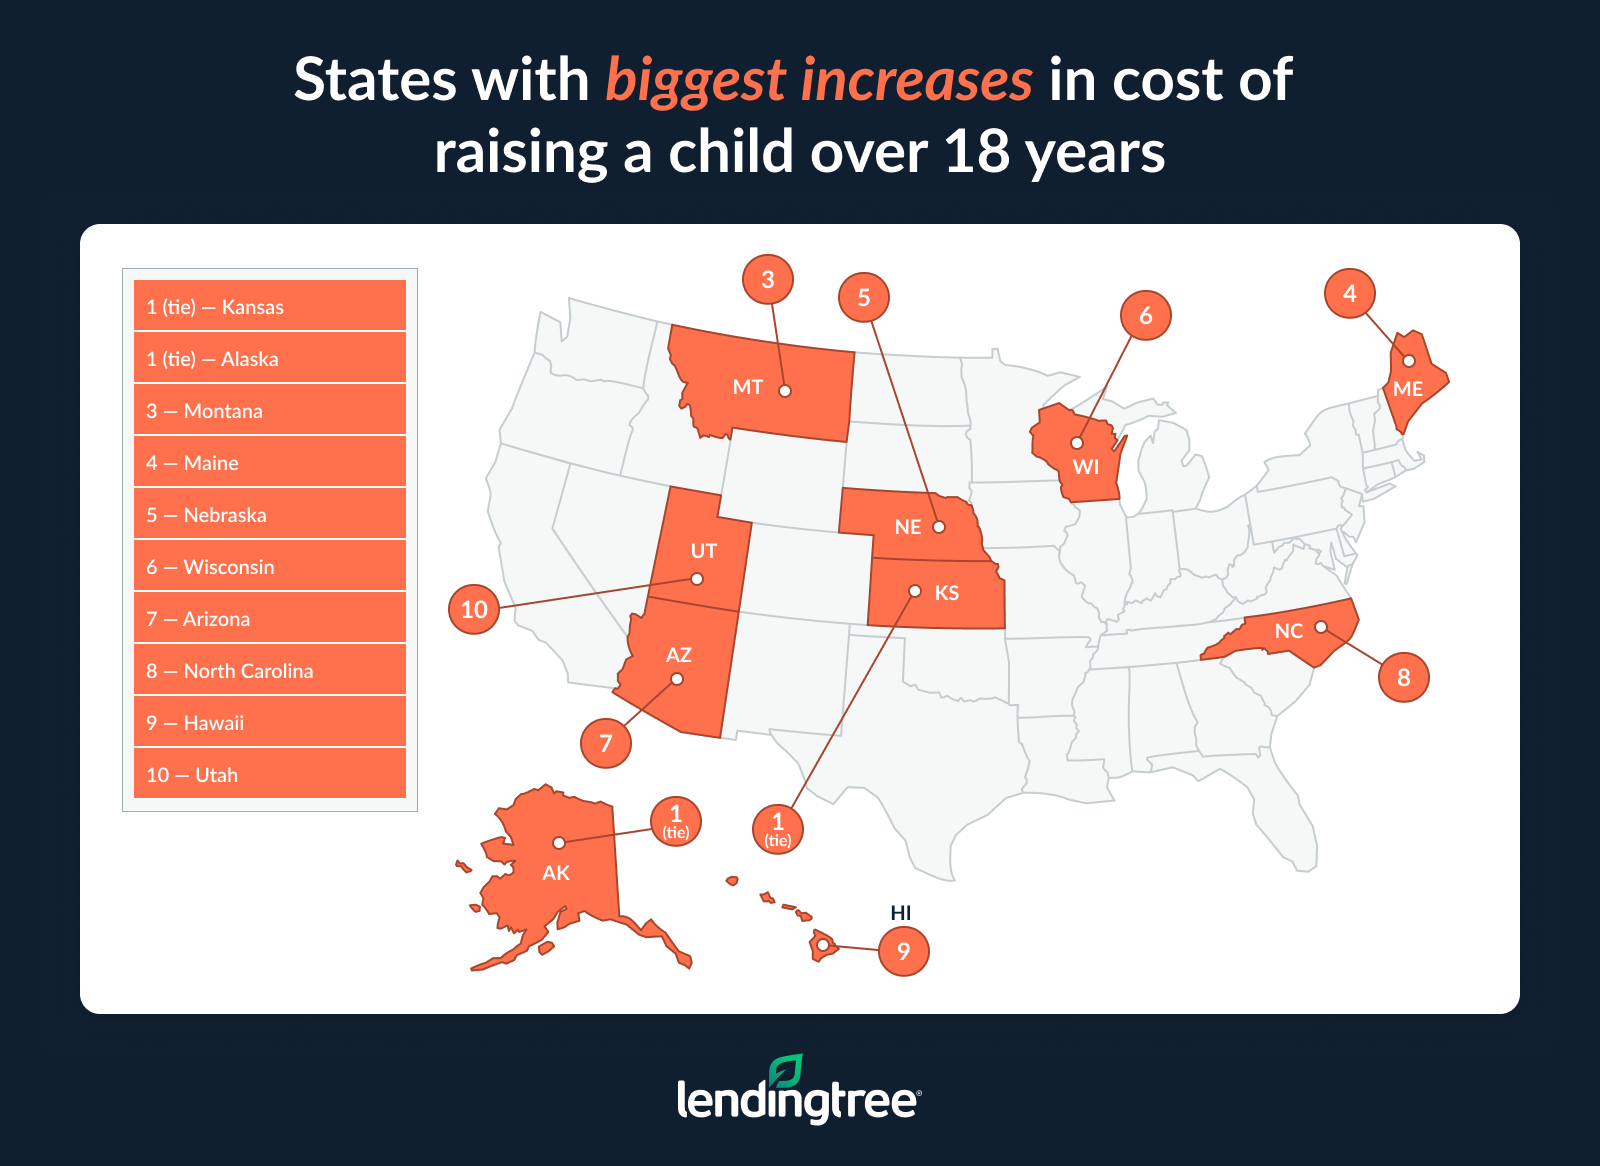
Conversely, four states saw 18-year costs drop by at least 10.0%, including two that fell by at least 20.0%. New Hampshire (down 29.3%) and North Dakota (20.3%) led the way, while Vermont (13.3%) and Wyoming (10.5%) also saw double-digit declines.
Florida saw the biggest jump (10.3%) among the nation’s most populous states, though California (8.8%) and New York (1.7%) also saw increases. Texas saw costs dip slightly, by 1.2%.
States with the biggest increases/decreases in costs of raising a child over 18 years (2025 vs. 2026 report)
| Rank | State | Cost, 2026 report | Cost, 2025 report | Difference (%) |
|---|---|---|---|---|
| 1 | Kansas | $303,250 | $245,581 | 23.5% |
| 1 | Alaska | $365,047 | $295,698 | 23.5% |
| 3 | Montana | $293,926 | $241,452 | 21.7% |
| 4 | Maine | $289,573 | $241,618 | 19.8% |
| 5 | Nebraska | $294,926 | $247,772 | 19.0% |
| 6 | Wisconsin | $253,332 | $218,304 | 16.0% |
| 7 | Arizona | $294,982 | $255,852 | 15.3% |
| 8 | North Carolina | $247,998 | $215,461 | 15.1% |
| 9 | Hawaii | $412,661 | $362,891 | 13.7% |
| 10 | Utah | $276,509 | $246,096 | 12.4% |
| 11 | West Virginia | $254,005 | $227,406 | 11.7% |
| 12 | New Jersey | $312,295 | $279,862 | 11.6% |
| 13 | Georgia | $222,713 | $201,058 | 10.8% |
| 14 | Florida | $280,280 | $254,031 | 10.3% |
| 15 | Mississippi | $208,621 | $190,402 | 9.6% |
| 16 | California | $312,300 | $286,951 | 8.8% |
| 17 | Illinois | $244,826 | $225,325 | 8.7% |
| 18 | Pennsylvania | $249,441 | $230,581 | 8.2% |
| 19 | Oregon | $257,569 | $240,086 | 7.3% |
| 20 | Colorado | $285,293 | $266,147 | 7.2% |
| 21 | Idaho | $278,023 | $260,942 | 6.5% |
| 22 | Kentucky | $232,131 | $218,777 | 6.1% |
| 23 | Indiana | $264,147 | $249,580 | 5.8% |
| 24 | Maryland | $326,360 | $310,040 | 5.3% |
| 25 | Missouri | $261,380 | $249,827 | 4.6% |
| 26 | District of Columbia | $202,115 | $194,108 | 4.1% |
| 27 | Arkansas | $226,354 | $220,259 | 2.8% |
| 28 | Alabama | $212,121 | $207,637 | 2.2% |
| 29 | Connecticut | $293,728 | $287,638 | 2.1% |
| 30 | Michigan | $233,218 | $229,187 | 1.8% |
| 31 | New York | $278,051 | $273,294 | 1.7% |
| 32 | South Carolina | $204,213 | $200,958 | 1.6% |
| 32 | Ohio | $224,228 | $220,785 | 1.6% |
| 34 | Delaware | $235,920 | $233,537 | 1.0% |
| 35 | Oklahoma | $241,405 | $241,269 | 0.1% |
| 36 | Virginia | $266,117 | $266,827 | -0.3% |
| 37 | Nevada | $244,944 | $245,822 | -0.4% |
| 38 | Texas | $229,891 | $232,690 | -1.2% |
| 39 | Rhode Island | $245,738 | $250,851 | -2.0% |
| 40 | Massachusetts | $273,981 | $282,007 | -2.8% |
| 41 | Louisiana | $242,450 | $250,395 | -3.2% |
| 42 | Minnesota | $262,330 | $276,361 | -5.1% |
| 43 | South Dakota | $222,976 | $238,318 | -6.4% |
| 44 | Washington | $297,341 | $318,714 | -6.7% |
| 45 | New Mexico | $218,588 | $234,483 | -6.8% |
| 46 | Tennessee | $235,164 | $252,669 | -6.9% |
| 47 | Iowa | $215,443 | $234,414 | -8.1% |
| 48 | Wyoming | $262,014 | $292,741 | -10.5% |
| 49 | Vermont | $229,428 | $264,771 | -13.3% |
| 50 | North Dakota | $259,123 | $325,158 | -20.3% |
| 51 | New Hampshire | $201,963 | $285,834 | -29.3% |
Average of 21.9% of income spent on added care costs
The total costs of raising a child for the first five years are staggering. However, those dollar values don’t tell the whole story. To fully reveal the impact of these costs on families, you have to take income into account.
Again, the numbers look worst in Hawaii. Parents in Hawaii are projected to spend 27.4% of their annual income on raising a small child, the highest percentage in the nation. Nebraska (23.5%) and Indiana (23.2%) follow. In all, there were 22 states where parents should expect to spend at least 20.0% of their yearly income on raising a small child.
Meanwhile, the percentage is lowest in the District of Columbia (13.9%), New Hampshire (14.9%) and South Dakota (15.4%).
States where families spend the smallest portion of their income on raising children (2026 report)
| Rank | State | Avg. family income | Total annual cost to raise small child | % of income to raise child |
|---|---|---|---|---|
| 1 | District of Columbia | $216,504 | $30,146 | 13.9% |
| 2 | New Hampshire | $152,983 | $22,805 | 14.9% |
| 3 | South Dakota | $120,707 | $18,622 | 15.4% |
| 4 | Georgia | $124,976 | $20,365 | 16.3% |
| 5 | Texas | $127,060 | $20,968 | 16.5% |
| 6 | South Carolina | $113,803 | $18,910 | 16.6% |
| 7 | Alabama | $108,061 | $18,019 | 16.7% |
| 8 | Connecticut | $168,657 | $29,674 | 17.6% |
| 8 | Iowa | $120,317 | $21,137 | 17.6% |
| 10 | Virginia | $151,714 | $26,915 | 17.7% |
| 11 | North Dakota | $129,785 | $23,278 | 17.9% |
| 12 | Mississippi | $94,579 | $17,148 | 18.1% |
| 13 | Utah | $136,485 | $25,588 | 18.7% |
| 13 | Nevada | $121,376 | $22,751 | 18.7% |
| 15 | North Carolina | $120,769 | $22,712 | 18.8% |
| 15 | Pennsylvania | $130,780 | $24,626 | 18.8% |
| 15 | Arkansas | $102,160 | $19,204 | 18.8% |
| 18 | Ohio | $118,759 | $22,409 | 18.9% |
| 18 | Michigan | $119,824 | $22,673 | 18.9% |
| 20 | New Jersey | $168,255 | $31,948 | 19.0% |
| 20 | Delaware | $132,369 | $25,108 | 19.0% |
| 22 | Rhode Island | $139,376 | $27,003 | 19.4% |
| 23 | Idaho | $118,347 | $23,107 | 19.5% |
| 23 | Massachusetts | $175,192 | $34,247 | 19.5% |
| 25 | Tennessee | $114,915 | $22,545 | 19.6% |
| 26 | Wyoming | $120,454 | $23,789 | 19.7% |
| 27 | New York | $151,821 | $30,209 | 19.9% |
| 27 | Oklahoma | $106,547 | $21,218 | 19.9% |
| 27 | Vermont | $131,877 | $26,259 | 19.9% |
| 30 | Illinois | $139,698 | $27,906 | 20.0% |
| 31 | Louisiana | $105,213 | $21,303 | 20.2% |
| 32 | Washington | $157,343 | $31,937 | 20.3% |
| 32 | Florida | $123,165 | $24,968 | 20.3% |
| 32 | Colorado | $153,060 | $31,000 | 20.3% |
| 35 | Minnesota | $143,997 | $29,322 | 20.4% |
| 36 | Missouri | $117,375 | $24,473 | 20.9% |
| 36 | Kentucky | $105,537 | $22,097 | 20.9% |
| 38 | Alaska | $138,272 | $29,024 | 21.0% |
| 39 | New Mexico | $103,819 | $21,909 | 21.1% |
| 40 | California | $157,446 | $33,692 | 21.4% |
| 41 | Oregon | $132,283 | $28,393 | 21.5% |
| 42 | Wisconsin | $123,947 | $27,047 | 21.8% |
| 43 | West Virginia | $98,068 | $21,651 | 22.1% |
| 44 | Arizona | $125,215 | $27,917 | 22.3% |
| 45 | Maine | $122,361 | $27,448 | 22.4% |
| 46 | Maryland | $162,068 | $36,419 | 22.5% |
| 47 | Montana | $120,474 | $27,220 | 22.6% |
| 48 | Kansas | $121,807 | $27,793 | 22.8% |
| 49 | Indiana | $114,534 | $26,576 | 23.2% |
| 50 | Nebraska | $125,584 | $29,491 | 23.5% |
| 51 | Hawaii | $147,418 | $40,342 | 27.4% |
Tips for navigating the staggering cost of raising a child
- Start saving as soon as possible. Like today. If you’re thinking that you want to have a child in the next few years, it isn’t too early to start a fund devoted to the cost of raising a child. Put a few dollars from each paycheck into a high-yield savings account and let compounding interest work its magic. By the time your little one arrives, you’ll be glad you did.
- Take advantage of government and/or workplace benefits. Once you know your child is on the way, reach out to your company’s HR department to go over what benefits are offered for parents. If you don’t take the time to do that, you could leave money on the table, and that’s the last thing any parent should do. Also, use a dependent care flexible spending account (FSA) to pay for at least a portion of your child care costs with pretax dollars. Finally, make sure that when tax season arrives, you’re claiming all the credits you qualify for.
- Remember that more expensive isn’t always better. There are items that are worth spending a little extra on when you’re a parent, but so many other things aren’t worth it. For those items, consignment shops, dollar stores, clearance racks and bargain bins are your friend. And speaking of friends, lean on them and your relatives, when possible, for hand-me-downs and gently used goods that can be a real help to you. Of course, you need to be certain that what you’re getting second-hand is still in good condition, but take advantage of it if so. Your kid won’t know the difference, but your wallet will.
- Knock down your high-interest debt. Money that’s going to pay down credit card debt is money that can’t go to your “we’re going to have a kid” fund, so reducing that debt should be a priority for you. That’s easier said than done, of course, but a 0% balance transfer credit card can be a game-changer, and a low-interest personal loan can also be a massive help. You can even call your credit card issuer and ask for a lower rate — it works more often than you might think.
Methodology
LendingTree researchers used various data sources to calculate the average annual costs associated with raising a small child in a two-earner household in each state and the District of Columbia.
Our calculations incorporated expenses for rent, food, infant day care, apparel, transportation and health insurance premiums. Dependent tax benefits — whether exemptions or credits — were subtracted from expenses to create the average annual cost to raise a child by state. To determine the value of tax exemptions, researchers assumed parents’ tax returns were filed jointly with a combined income of $99,999 (the national median income among families in 2024, the latest year for which data was available).
Researchers analyzed data from the following sources:
- U.S. Census Bureau 2024 American Community Survey with five-year estimates and one-year estimates (tabulated and microdata)
- U.S. Bureau of Labor Statistics (BLS) Consumer Expenditure Surveys, 2024
- Massachusetts Institute of Technology (MIT) Living Wage Calculator, retrieved in February 2026
- Price of Care: 2024 report from Child Care Aware of America
- Care.com 2026 Cost of Care Report
- U.S. Bureau of Economic Analysis (BEA) regional price parities
- KFF, 2024
- Tax Foundation, 2025
- IRS, 2025
Get debt consolidation loan offers from up to 5 lenders in minutes