The 25 US Metros Where a Family of 3 Can Make 6 Figures and Still Be Broke


In 1 of every 4 large U.S. metros, a monthly income for a family of three earning $100,000 a year isn’t enough to cover that family’s basic expenses.
That’s the sobering truth that emerged from this LendingTree analysis: In much of America, a six-figure salary still leaves you and your family broke, even before you put a cent toward paying down debt.
Here’s more on what we found.
Key findings
- In 25 of the 100 largest U.S. metros, monthly spending on basic expenses is higher than the monthly income for a family of three that earns $100,000 annually. All 10 California metros among the nation’s 100 largest are included in these 25.
- In San Jose, Calif., a family of three that earns $100,000 a year would be $2,207 in the red monthly after spending on the basics — the highest on our list. San Jose takes this spot by having the highest housing (an average of $2,881 a month for a two-bedroom rental) and transportation (an average of $1,586 monthly) costs among the metros analyzed. San Francisco ($1,804 in the red) and Boston ($1,613) are closest.
- McAllen, Texas, is the most affordable, with a family of three that earns $100,000 annually having $1,770 left over monthly after expenses. The cost of living in this Texas metro is about 14% cheaper than the national average, the lowest among the largest metros. Little Rock, Ark. ($1,608), and El Paso, Texas ($1,554), are next.
We based our calculations on a family of three (two adults and a child) that earns a gross income of $8,333 monthly, or $100,000 annually.
We categorized the following spending categories as “the basics,” though that can differ by family, metro and other factors:
- Housing: We assumed our family of three rents a two-bedroom apartment. Calculations are at the metro level.
- Child care: We assumed the family pays for monthly center-based infant day care. Calculations are at the state level, and we applied a cost-of-living multiplier based on the metro.
- Transportation: This metric measures the total cost of transportation, including car ownership, travel and transit costs. Calculations are at the metro level.
- Health insurance: This is the monthly employee contribution amount based on the average annual family premium for employer-based health insurance. Calculations are at the state level.
- Food, entertainment and utilities: We assumed our family of three matches average national expenditures for someone earning $100,000 to $149,999 annually. We applied a cost-of-living multiplier based on the metro.
- Federal and state taxes: We assumed the couple filed their 2024 federal and state taxes jointly. They took the standard federal deduction and received a $2,000 federal child tax credit. At the state level, they utilized the standard deduction and applicable credits. Additionally, their 401(k) contributions and employer-sponsored health insurance premiums are deducted from their pretax income before calculating taxable income for federal and state taxes.
- Federal payroll taxes: We also included FICA, or federal payroll, taxes, which consist of Social Security (6.2%) and Medicare (1.45%) on eligible income.
- 401(k) contribution: We assumed our family of three files jointly and invests $6,000 yearly into their 401(k), or $500 monthly.
It’s important to note that no debt payments were factored into our calculations. See the methodology for more details.
In 25 of 100 largest U.S. metros, you can earn 6 figures and still be broke
For generations of Americans, $100,000 has long been a magic number. It has been seen as a level of yearly earnings that says: “You’ve made it. You’re successful.”
Even if you don’t feel rich, you should feel financially stable and not have to worry about paying your basic bills monthly. That makes sense when you consider that the median household income in the U.S. was $80,610 in 2023, according to the most recent U.S. Census Bureau data. Just 10 years earlier in 2013, it was just $68,220.
For some people in some locations, $100,000 is still magical today. However, that has changed dramatically in many of the nation’s biggest metros. In 25 of the 100 largest metros in this country, a six-figure household income isn’t enough to handle the basics.
Metros where basic expenses are higher than the monthly income of a family earning $100,000 annually
| Rank | Metro | Monthly expenditures | Net monthly income |
|---|---|---|---|
| 1 | San Jose, CA | $10,540 | -$2,207 |
| 2 | San Francisco, CA | $10,137 | -$1,804 |
| 3 | Boston, MA | $9,946 | -$1,613 |
| 4 | Honolulu, HI | $9,824 | -$1,491 |
| 5 | Oxnard, CA | $9,805 | -$1,472 |
| 6 | Washington, DC | $9,767 | -$1,434 |
| 7 | Los Angeles, CA | $9,587 | -$1,254 |
| 8 | San Diego, CA | $9,581 | -$1,248 |
| 9 | Seattle, WA | $9,376 | -$1,043 |
| 10 | Poughkeepsie, NY | $9,205 | -$872 |
| 11 | New York, NY | $9,077 | -$744 |
| 12 | Riverside, CA | $9,062 | -$729 |
| 13 | Sacramento, CA | $9,037 | -$704 |
| 14 | Worcester, MA | $9,032 | -$699 |
| 15 | Bridgeport, CT | $9,010 | -$677 |
| 16 | Denver, CO | $8,963 | -$630 |
| 17 | Stockton, CA | $8,886 | -$553 |
| 18 | Baltimore, MD | $8,842 | -$509 |
| 19 | Portland, OR | $8,789 | -$456 |
| 20 | Minneapolis, MN | $8,650 | -$317 |
| 21 | New Haven, CT | $8,452 | -$119 |
| 22 | Fresno, CA | $8,423 | -$90 |
| 22 | Hartford, CT | $8,423 | -$90 |
| 24 | Colorado Springs, CO | $8,373 | -$40 |
| 25 | Bakersfield, CA | $8,349 | -$16 |
Ten California metros are among the nation’s 100 largest. All 10 are on this portion of our list, ranging from San Jose (with a net monthly income of negative $2,207 after basic expenses) to Bakersfield (negative $16). Four other states have multiple metros in the red:
- Connecticut (three)
- Colorado (two)
- Massachusetts (two)
- New York (two)
As shocking as these numbers might be, remember: We didn’t factor in debt payments. If we had done that, the number of metros in which six-figure earners are still broke would be far larger.
2 Bay Area metros top list
Among the 25 “six figures and broke” metros, there’s a wide disparity in how broke residents would be. In four, residents are less than $100 in the red each month, including two (Colorado Springs, Colo., and Bakersfield) where that number is $40 or less. On the flip side, however, the difference between monthly income and expenses is $1,000 or more in nine metros. That’s a big deal.
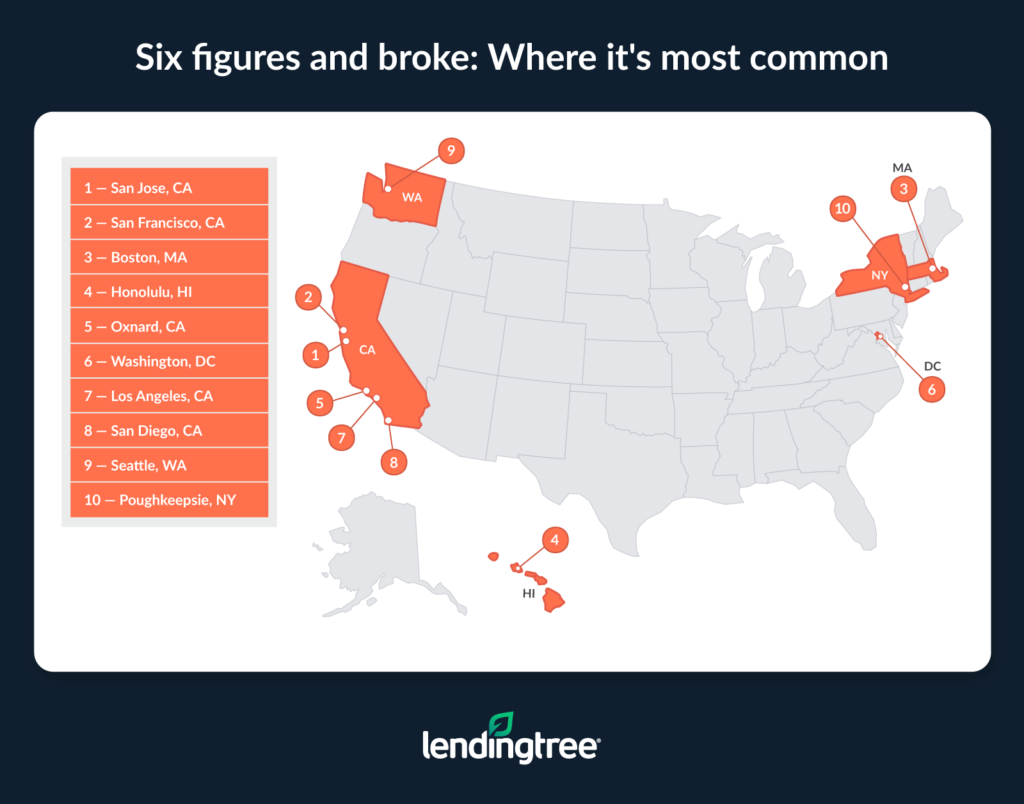
Five of those nine metros are in California, including the two at the top. In San Jose, the average basic expenses would leave you $2,207 in the red each month if you made $100,000 yearly, while average expenses in San Francisco would leave you $1,804 in the red.
As the map shows, the metros at the top are all on the East or West Coast, except Honolulu. At the other end of the spectrum, the map looks quite different.
Texas, Ohio dominate list of most affordable metros
While those living in many metros are forced to struggle mightily while earning six figures, our analysis shows that’s not the case everywhere. In fact, in 31 of the nation’s 100 biggest metros — nearly 1 in 3 — $100,000 earners would still have $1,000 or more left over each month after paying basic expenses.
McAllen, Texas, is where we found the biggest discrepancy. McAllen residents would have $1,770 left over. People in Little Rock, Ark., and El Paso, Texas, aren’t far behind, with $1,608 and $1,554, respectively.
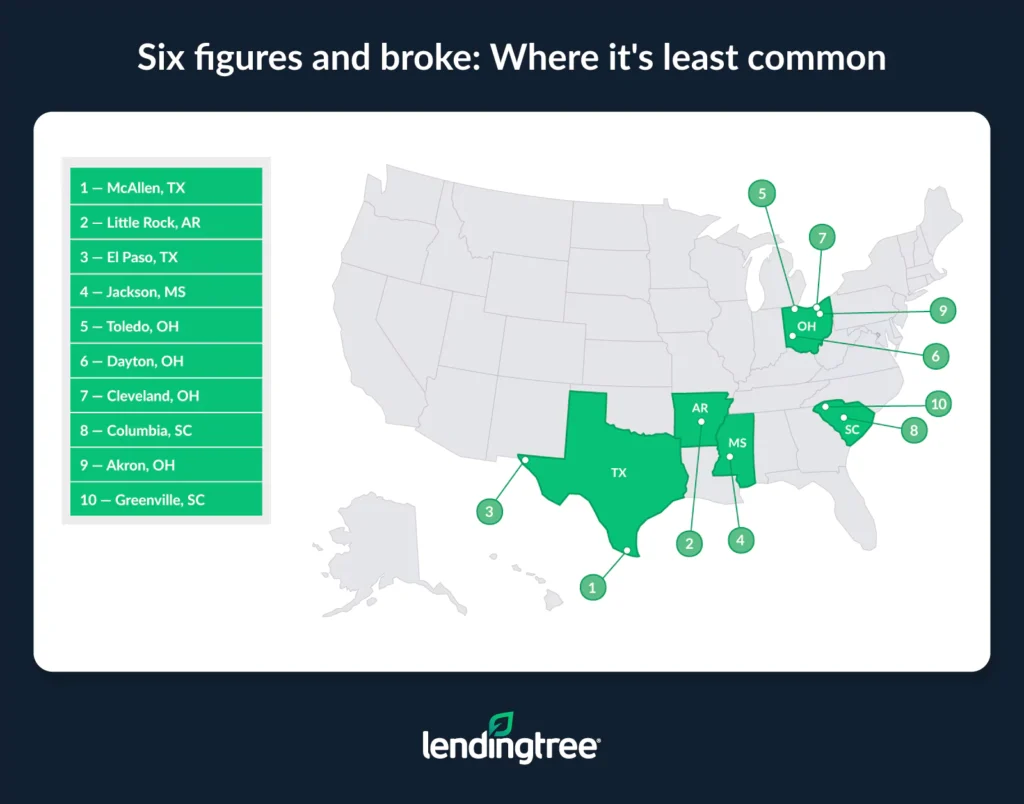
Ohio is home to four of the 10 most affordable metros, with Toledo, Dayton, Cleveland and Akron making the list. The only metros on the East or West Coast to make the top 10: Columbia and Greenville, S.C.
Full rankings: Where you can earn 6 figures and still be broke
| Rank | Metro | Net monthly income | Housing | Child care | Transportation | Health insurance | Food | Entertainment | Utilities | Federal taxes | State taxes | Federal payroll taxes | 401(k) |
|---|---|---|---|---|---|---|---|---|---|---|---|---|---|
| 1 | San Jose, CA | -$2,207 | $2,881 | $1,839 | $1,586 | $647 | $1,125 | $376 | $499 | $365 | $84 | $638 | $500 |
| 2 | San Francisco, CA | -$1,804 | $2,591 | $1,925 | $1,292 | $647 | $1,178 | $394 | $523 | $365 | $84 | $638 | $500 |
| 3 | Boston, MA | -$1,613 | $2,077 | $2,232 | $1,203 | $633 | $1,112 | $372 | $493 | $367 | $319 | $638 | $500 |
| 4 | Honolulu, HI | -$1,491 | $2,071 | $2,074 | $1,364 | $425 | $1,098 | $367 | $487 | $392 | $408 | $638 | $500 |
| 5 | Oxnard, CA | -$1,472 | $2,174 | $1,849 | $1,537 | $647 | $1,131 | $378 | $502 | $365 | $84 | $638 | $500 |
| 6 | Washington, DC | -$1,434 | $1,985 | $2,306 | $1,210 | $545 | $1,082 | $362 | $480 | $377 | $282 | $638 | $500 |
| 7 | Los Angeles, CA | -$1,254 | $2,140 | $1,881 | $1,285 | $647 | $1,151 | $385 | $511 | $365 | $84 | $638 | $500 |
| 8 | San Diego, CA | -$1,248 | $2,198 | $1,816 | $1,358 | $647 | $1,111 | $371 | $493 | $365 | $84 | $638 | $500 |
| 9 | Seattle, WA | -$1,043 | $1,987 | $1,918 | $1,323 | $642 | $1,126 | $376 | $500 | $366 | $0 | $638 | $500 |
| 10 | Poughkeepsie, NY | -$872 | $1,674 | $1,790 | $1,390 | $610 | $1,093 | $365 | $485 | $369 | $291 | $638 | $500 |
| 11 | New York, NY | -$744 | $1,815 | $1,836 | $1,025 | $610 | $1,121 | $375 | $497 | $369 | $291 | $638 | $500 |
| 12 | Riverside, CA | -$729 | $1,668 | $1,758 | $1,491 | $647 | $1,075 | $359 | $477 | $365 | $84 | $638 | $500 |
| 13 | Sacramento, CA | -$704 | $1,712 | $1,774 | $1,387 | $647 | $1,085 | $363 | $482 | $365 | $84 | $638 | $500 |
| 14 | Worcester, MA | -$699 | $1,403 | $2,040 | $1,324 | $633 | $1,017 | $340 | $451 | $367 | $319 | $638 | $500 |
| 15 | Bridgeport, CT | -$677 | $1,902 | $1,588 | $1,299 | $638 | $1,061 | $355 | $471 | $366 | $192 | $638 | $500 |
| 16 | Denver, CO | -$630 | $1,881 | $1,721 | $1,235 | $534 | $1,051 | $351 | $466 | $379 | $207 | $638 | $500 |
| 17 | Stockton, CA | -$553 | $1,485 | $1,749 | $1,515 | $647 | $1,070 | $358 | $475 | $365 | $84 | $638 | $500 |
| 18 | Baltimore, MD | -$509 | $1,623 | $1,704 | $1,235 | $686 | $1,024 | $342 | $454 | $360 | $276 | $638 | $500 |
| 19 | Portland, OR | -$456 | $1,664 | $1,571 | $1,279 | $345 | $1,062 | $355 | $471 | $401 | $503 | $638 | $500 |
| 20 | Minneapolis, MN | -$317 | $1,487 | $1,753 | $1,272 | $521 | $1,042 | $348 | $462 | $380 | $247 | $638 | $500 |
| 21 | New Haven, CT | -$119 | $1,536 | $1,543 | $1,204 | $638 | $1,032 | $345 | $458 | $366 | $192 | $638 | $500 |
| 22 | Fresno, CA | -$90 | $1,240 | $1,694 | $1,412 | $647 | $1,037 | $346 | $460 | $365 | $84 | $638 | $500 |
| 22 | Hartford, CT | -$90 | $1,457 | $1,529 | $1,284 | $638 | $1,023 | $342 | $454 | $366 | $192 | $638 | $500 |
| 24 | Colorado Springs, CO | -$40 | $1,498 | $1,589 | $1,301 | $534 | $971 | $325 | $431 | $379 | $207 | $638 | $500 |
| 25 | Bakersfield, CA | -$16 | $1,138 | $1,665 | $1,501 | $647 | $1,019 | $340 | $452 | $365 | $84 | $638 | $500 |
| 26 | Albany, NY | $40 | $1,311 | $1,593 | $1,251 | $610 | $973 | $325 | $432 | $369 | $291 | $638 | $500 |
| 27 | Phoenix, AZ | $140 | $1,555 | $1,234 | $1,272 | $651 | $1,051 | $351 | $466 | $365 | $110 | $638 | $500 |
| 28 | Miami, FL | $170 | $1,796 | $1,178 | $1,106 | $594 | $1,114 | $372 | $494 | $371 | $0 | $638 | $500 |
| 29 | Richmond, VA | $183 | $1,367 | $1,339 | $1,253 | $656 | $977 | $327 | $433 | $364 | $296 | $638 | $500 |
| 30 | Rochester, NY | $197 | $1,177 | $1,594 | $1,225 | $610 | $974 | $326 | $432 | $369 | $291 | $638 | $500 |
| 31 | Chicago, IL | $201 | $1,391 | $1,400 | $1,160 | $515 | $1,023 | $342 | $454 | $381 | $328 | $638 | $500 |
| 32 | Spokane, WA | $212 | $1,201 | $1,714 | $1,270 | $642 | $1,007 | $336 | $447 | $366 | $0 | $638 | $500 |
| 33 | Virginia Beach, VA | $267 | $1,340 | $1,331 | $1,214 | $656 | $971 | $325 | $431 | $364 | $296 | $638 | $500 |
| 34 | Syracuse, NY | $339 | $1,102 | $1,554 | $1,243 | $610 | $949 | $317 | $421 | $369 | $291 | $638 | $500 |
| 35 | Philadelphia, PA | $360 | $1,494 | $1,249 | $1,137 | $496 | $1,032 | $345 | $458 | $383 | $241 | $638 | $500 |
| 36 | Providence, RI | $440 | $1,321 | $1,421 | $1,175 | $506 | $1,006 | $336 | $446 | $382 | $162 | $638 | $500 |
| 37 | Atlanta, GA | $472 | $1,516 | $930 | $1,335 | $503 | $1,006 | $336 | $446 | $382 | $269 | $638 | $500 |
| 38 | Orlando, FL | $482 | $1,624 | $1,065 | $1,267 | $594 | $1,008 | $337 | $447 | $371 | $0 | $638 | $500 |
| 39 | Raleigh, NC | $498 | $1,426 | $1,000 | $1,339 | $593 | $977 | $327 | $433 | $372 | $230 | $638 | $500 |
| 40 | North Port, FL | $516 | $1,595 | $1,091 | $1,192 | $594 | $1,033 | $345 | $458 | $371 | $0 | $638 | $500 |
| 41 | Salt Lake City, UT | $545 | $1,478 | $902 | $1,360 | $569 | $961 | $321 | $426 | $374 | $259 | $638 | $500 |
| 42 | Allentown, PA | $554 | $1,370 | $1,188 | $1,219 | $496 | $981 | $328 | $435 | $383 | $241 | $638 | $500 |
| 43 | Buffalo, NY | $562 | $1,013 | $1,541 | $1,136 | $610 | $941 | $315 | $417 | $369 | $291 | $638 | $500 |
| 44 | Cape Coral, FL | $576 | $1,496 | $1,081 | $1,258 | $594 | $1,023 | $342 | $454 | $371 | $0 | $638 | $500 |
| 45 | Dallas, TX | $591 | $1,558 | $949 | $1,281 | $616 | $1,030 | $344 | $457 | $369 | $0 | $638 | $500 |
| 46 | Austin, TX | $601 | $1,717 | $897 | $1,265 | $616 | $973 | $325 | $432 | $369 | $0 | $638 | $500 |
| 47 | Ogden, UT | $615 | $1,299 | $890 | $1,503 | $569 | $948 | $317 | $421 | $374 | $259 | $638 | $500 |
| 48 | Provo, UT | $645 | $1,232 | $889 | $1,543 | $569 | $947 | $317 | $420 | $374 | $259 | $638 | $500 |
| 49 | Tampa, FL | $659 | $1,497 | $1,089 | $1,153 | $594 | $1,031 | $344 | $457 | $371 | $0 | $638 | $500 |
| 50 | Madison, WI | $664 | $1,354 | $1,083 | $1,261 | $453 | $955 | $319 | $424 | $388 | $294 | $638 | $500 |
| 51 | Durham, NC | $709 | $1,383 | $986 | $1,210 | $593 | $963 | $322 | $427 | $372 | $230 | $638 | $500 |
| 52 | Charlotte, NC | $712 | $1,311 | $990 | $1,268 | $593 | $967 | $323 | $429 | $372 | $230 | $638 | $500 |
| 53 | Palm Bay, FL | $737 | $1,382 | $1,062 | $1,262 | $594 | $1,005 | $336 | $446 | $371 | $0 | $638 | $500 |
| 54 | Nashville, TN | $751 | $1,401 | $973 | $1,305 | $677 | $971 | $325 | $431 | $361 | $0 | $638 | $500 |
| 55 | Jacksonville, FL | $756 | $1,408 | $1,045 | $1,262 | $594 | $989 | $331 | $439 | $371 | $0 | $638 | $500 |
| 56 | Charleston, SC | $775 | $1,461 | $759 | $1,284 | $532 | $1,003 | $335 | $445 | $379 | $222 | $638 | $500 |
| 57 | Harrisburg, PA | $811 | $1,182 | $1,165 | $1,206 | $496 | $962 | $322 | $427 | $383 | $241 | $638 | $500 |
| 58 | Las Vegas, NV | $835 | $1,434 | $1,057 | $1,254 | $506 | $971 | $325 | $431 | $382 | $0 | $638 | $500 |
| 59 | Grand Rapids, MI | $858 | $1,166 | $1,005 | $1,339 | $506 | $949 | $317 | $421 | $382 | $252 | $638 | $500 |
| 59 | Deltona, FL | $858 | $1,353 | $1,040 | $1,230 | $594 | $984 | $329 | $436 | $371 | $0 | $638 | $500 |
| 61 | Houston, TX | $883 | $1,382 | $921 | $1,248 | $616 | $999 | $334 | $443 | $369 | $0 | $638 | $500 |
| 62 | Detroit, MI | $885 | $1,200 | $1,034 | $1,199 | $506 | $977 | $327 | $433 | $382 | $252 | $638 | $500 |
| 63 | Tucson, AZ | $887 | $1,203 | $1,103 | $1,205 | $651 | $940 | $314 | $417 | $365 | $110 | $638 | $500 |
| 64 | Indianapolis, IN | $922 | $1,132 | $1,083 | $1,262 | $525 | $943 | $315 | $418 | $380 | $215 | $638 | $500 |
| 65 | Kansas City, MO | $934 | $1,190 | $1,004 | $1,248 | $574 | $930 | $311 | $413 | $374 | $217 | $638 | $500 |
| 66 | Des Moines, IA | $941 | $1,127 | $940 | $1,263 | $549 | $924 | $309 | $410 | $377 | $355 | $638 | $500 |
| 67 | St. Louis, MO | $954 | $1,097 | $1,036 | $1,236 | $574 | $960 | $321 | $426 | $374 | $217 | $638 | $500 |
| 68 | Boise, ID | $978 | $1,297 | $787 | $1,349 | $514 | $931 | $311 | $413 | $381 | $234 | $638 | $500 |
| 69 | Wichita, KS | $981 | $972 | $1,124 | $1,274 | $523 | $892 | $298 | $396 | $380 | $355 | $638 | $500 |
| 70 | Lakeland, FL | $1,013 | $1,185 | $1,026 | $1,279 | $594 | $971 | $325 | $431 | $371 | $0 | $638 | $500 |
| 71 | Pittsburgh, PA | $1,025 | $1,054 | $1,139 | $1,184 | $496 | $941 | $315 | $417 | $383 | $241 | $638 | $500 |
| 72 | Omaha, NE | $1,026 | $1,175 | $1,002 | $1,261 | $522 | $922 | $308 | $409 | $380 | $190 | $638 | $500 |
| 73 | Milwaukee, WI | $1,028 | $1,137 | $1,080 | $1,123 | $453 | $952 | $318 | $422 | $388 | $294 | $638 | $500 |
| 74 | Columbus, OH | $1,095 | $1,246 | $973 | $1,187 | $508 | $942 | $315 | $418 | $382 | $129 | $638 | $500 |
| 75 | Albuquerque, NM | $1,102 | $1,123 | $1,048 | $1,175 | $532 | $927 | $310 | $411 | $379 | $188 | $638 | $500 |
| 76 | San Antonio, TX | $1,118 | $1,332 | $861 | $1,239 | $616 | $934 | $312 | $414 | $369 | $0 | $638 | $500 |
| 77 | Scranton, PA | $1,137 | $957 | $1,122 | $1,211 | $496 | $927 | $310 | $411 | $383 | $241 | $638 | $500 |
| 78 | Baton Rouge, LA | $1,154 | $1,091 | $764 | $1,345 | $685 | $905 | $303 | $401 | $360 | $187 | $638 | $500 |
| 79 | Greensboro, NC | $1,180 | $1,001 | $946 | $1,230 | $593 | $924 | $309 | $410 | $372 | $230 | $638 | $500 |
| 80 | Knoxville, TN | $1,200 | $1,090 | $927 | $1,296 | $677 | $925 | $309 | $410 | $361 | $0 | $638 | $500 |
| 81 | Cincinnati, OH | $1,207 | $1,088 | $969 | $1,244 | $508 | $938 | $314 | $416 | $382 | $129 | $638 | $500 |
| 82 | New Orleans, LA | $1,216 | $1,217 | $767 | $1,148 | $685 | $908 | $304 | $403 | $360 | $187 | $638 | $500 |
| 83 | Augusta, GA | $1,226 | $1,021 | $839 | $1,343 | $503 | $907 | $303 | $402 | $382 | $269 | $638 | $500 |
| 84 | Chattanooga, TN | $1,240 | $1,058 | $927 | $1,288 | $677 | $925 | $309 | $410 | $361 | $0 | $638 | $500 |
| 85 | Winston-Salem, NC | $1,266 | $927 | $933 | $1,254 | $593 | $911 | $305 | $404 | $372 | $230 | $638 | $500 |
| 86 | Memphis, TN | $1,272 | $1,078 | $923 | $1,246 | $677 | $921 | $308 | $409 | $361 | $0 | $638 | $500 |
| 87 | Louisville, KY | $1,281 | $1,080 | $759 | $1,251 | $504 | $937 | $313 | $416 | $382 | $272 | $638 | $500 |
| 88 | Birmingham, AL | $1,288 | $1,070 | $677 | $1,274 | $567 | $923 | $309 | $409 | $375 | $303 | $638 | $500 |
| 89 | Oklahoma City, OK | $1,296 | $1,054 | $763 | $1,267 | $579 | $907 | $303 | $402 | $373 | $251 | $638 | $500 |
| 90 | Tulsa, OK | $1,339 | $1,031 | $751 | $1,285 | $579 | $892 | $298 | $396 | $373 | $251 | $638 | $500 |
| 91 | Greenville, SC | $1,341 | $1,081 | $700 | $1,296 | $532 | $925 | $309 | $410 | $379 | $222 | $638 | $500 |
| 92 | Akron, OH | $1,351 | $1,029 | $955 | $1,197 | $508 | $925 | $309 | $410 | $382 | $129 | $638 | $500 |
| 93 | Columbia, SC | $1,359 | $1,096 | $700 | $1,260 | $532 | $926 | $310 | $411 | $379 | $222 | $638 | $500 |
| 94 | Cleveland, OH | $1,393 | $1,031 | $957 | $1,147 | $508 | $927 | $310 | $411 | $382 | $129 | $638 | $500 |
| 95 | Dayton, OH | $1,431 | $974 | $950 | $1,185 | $508 | $920 | $308 | $408 | $382 | $129 | $638 | $500 |
| 96 | Toledo, OH | $1,501 | $950 | $930 | $1,193 | $508 | $901 | $301 | $400 | $382 | $129 | $638 | $500 |
| 97 | Jackson, MS | $1,550 | $1,044 | $619 | $1,281 | $472 | $904 | $302 | $401 | $386 | $236 | $638 | $500 |
| 98 | El Paso, TX | $1,554 | $985 | $829 | $1,243 | $616 | $899 | $301 | $399 | $369 | $0 | $638 | $500 |
| 99 | Little Rock, AR | $1,608 | $966 | $659 | $1,247 | $496 | $888 | $297 | $394 | $383 | $257 | $638 | $500 |
| 100 | McAllen, TX | $1,770 | $922 | $786 | $1,216 | $616 | $853 | $285 | $378 | $369 | $0 | $638 | $500 |
Manage high costs of living by controlling what you can
There’s no question these results can be downright terrifying. If I can’t feel financially stable making six figures a year, what am I supposed to do?
The truth is, there aren’t easy answers. There are simple answers — make more money, pay off your debt, move to a cheaper location — but these things are by no means easy to accomplish. If they were, we’d all do them and reports like this wouldn’t exist.
Still, that doesn’t mean you’re powerless. Here are a few moves you can make to take back some control of your financial situation:
- Lower your interest rate. Again, this report doesn’t touch on the impact debt has on people’s financial situation. However, the reality is that millions of Americans are drowning in various types of debt, which makes it that much harder to pay basic expenses. Reducing the interest rate you’re paying, especially on high-interest debt like credit card debt, can make a huge difference. It reduces the amount of interest you pay over the life of the balance and the time it takes to pay off the balance. That’s a big, big deal. You can do this with a 0% balance transfer credit card or a low-interest debt consolidation loan. You can even call your credit card issuer and ask for a lower rate on your card. That works way more often than you might think.
- Track your accomplishments regularly. The conventional wisdom around salaries has long been that you need to change companies to get the biggest bump. In today’s super-tight job market, that may not be as easy, meaning it may make more sense to angle for a promotion and raise with your current company. That begins with tracking your accomplishments. Take the time each week or two to note what you’ve done recently — everything from your daily doings to times you went above and beyond. When it’s time to talk about a raise, you’ll be able to cherry-pick the most impactful thing from a long list rather than having to wrack your brain to come up with something.
- Stay longer to save more. If you’re renting and are happy where you are, consider signing a longer lease the next time you renew your deal. Being willing to commit to a longer contract means more stability for your landlord and might land you a slightly lower monthly rent payment. It could also be a way to avoid a future rent increase, but you likely won’t know if you don’t ask.
- Build your emergency savings. Wait, wait, wait. If I’m broke, how am I going to grow my savings? Remember, this report assumes someone puts $500 a month into a 401(k). If you don’t have a substantial emergency fund, it’s worth considering redirecting some of that $500 to a high-yield savings account instead. It’s not a decision that should be made lightly, however. There’s an opportunity cost to saving that money rather than investing for the long run. Also, if reducing your contributions to your 401(k) means you don’t get the maximum match available from your employer, it may not be the right choice, since 401(k) matches are free money. However, tough financial times require decisions and sacrifice, and building an emergency fund can help you better prepare.
Methodology
LendingTree researchers analyzed multiple sources to determine the metros where you can earn six figures and still be broke.
We started with the 100 largest metros in the U.S., basing our calculations on a family of three (two adults and a child) that earns a gross income of $8,333 monthly, or $100,000 annually.
The spending categories we included were:
- Housing: We assumed our family of three rents a two-bedroom apartment. Calculations are at the metro level. (U.S. Census Bureau 2023 American Community Survey — ACS — with five-year estimates)
- Child care: We assumed the family pays for monthly center-based infant day care. Calculations are at the state level, and we applied a cost-of-living multiplier based on the metro. (Child Care Aware of America’s Parents and the High Cost of Child Care 2023 report, U.S. Bureau of Economic Analysis — BEA)
- Transportation: This metric measures the total cost of transportation, including car ownership, travel and transit costs. Calculations are at the metro level. (Center for Neighborhood Technology Housing and Transportation Affordability Index, 2022)
- Health care: This is the monthly employee contribution amount based on the average annual family premium for employer-based health insurance. Calculations are at the state level. (KFF, 2023)
- Food, entertainment and utilities: We assumed our family of three matches average national expenditures for someone earning $100,000 to $149,999 annually. We applied a cost-of-living multiplier based on the metro. (U.S. Bureau of Labor Statistics — BLS — 2023 Consumer Expenditure Survey, U.S. BEA)
- Federal and state taxes: Our study assumes the couple filed their 2024 federal and state taxes jointly. They took the standard federal deduction and received a $2,000 federal child tax credit. At the state level, they utilized the standard deduction and applicable credits. Additionally, their 401(k) contributions and employer-sponsored health insurance premiums are deducted from their pretax income before calculating taxable income for federal and state taxes. (IRS, Tax Foundation, 2024)
- Federal payroll taxes: We also included FICA, or federal payroll, taxes, which consist of Social Security (6.2%) and Medicare (1.45%) on eligible income. (IRS)
- 401(k) contribution: We assumed our family of three files jointly and invests $6,000 yearly into their 401(k), or $500 monthly.
To estimate the net monthly income, we estimated the monthly cost of each of the categories. We then subtracted that figure from the $8,333 monthly income of a household earning $100,000.
Get debt consolidation loan offers from up to 5 lenders in minutes
Recommended Articles