Where Home Improvement Loans Are Most — and Least — Common
An unfortunate aspect of being a homeowner is that you sometimes need to pay for home improvements. What these improvements look like and how much they cost can vary significantly, and some projects might only be doable with a loan.
With that in mind (and to better understand how common home improvement loans are), LendingTree analyzed 2022 Home Mortgage Disclosure Act (HMDA) data to determine where the most home improvement loans are originated. Specifically, we looked at the number of first- and second-lien mortgages used to pay for home improvements for every 100,000 owner-occupied homes in each state.
While home improvement loans are relatively rare compared to the number of owner-occupied homes in a given state, they can offer significant amounts of money to those who receive them.
Key findings
- Across the 50 states, an average of 361.2 home improvement loans are originated for every 100,000 owner-occupied houses.
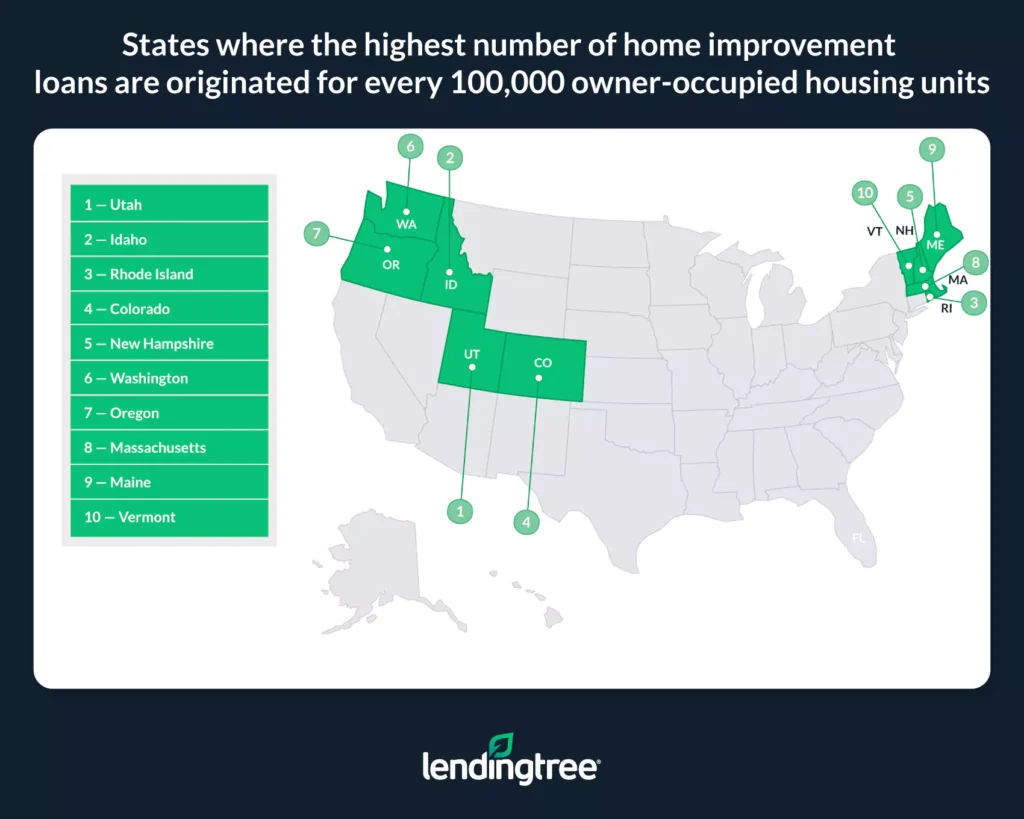
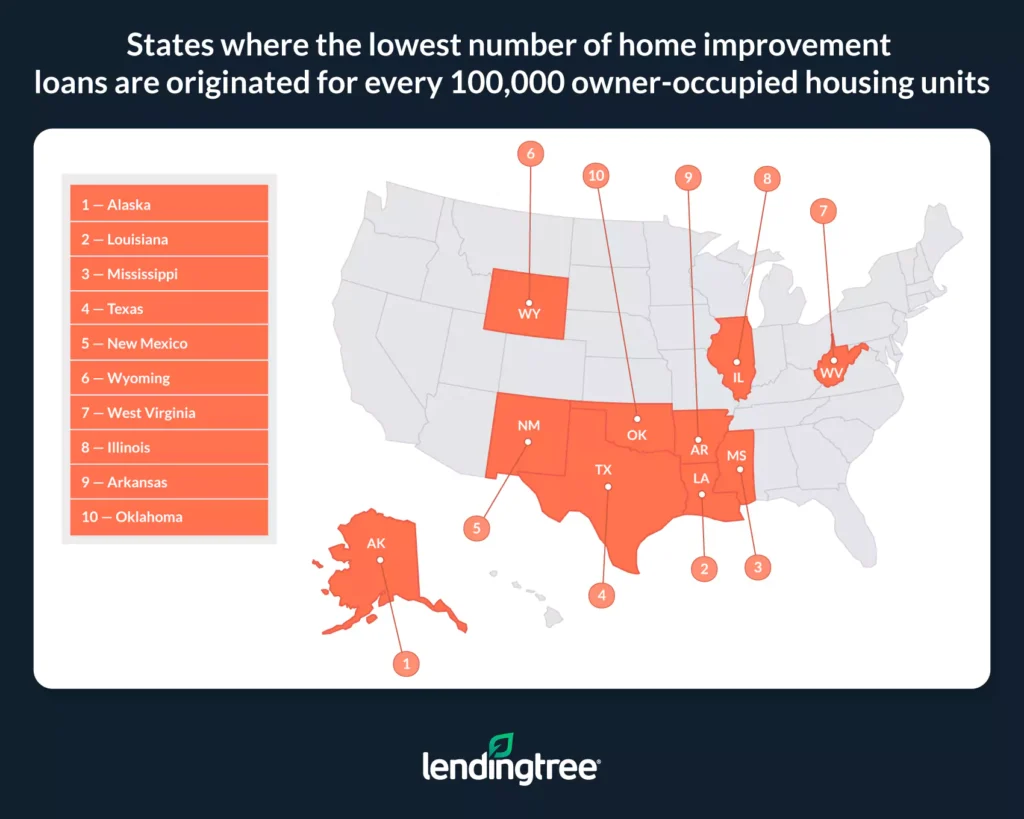
- Relative to the number of owner-occupied housing units, the most home improvement loans are originated in Utah, Idaho and Rhode Island, while the fewest are originated in Alaska, Louisiana and Mississippi. Across Utah, Idaho and Rhode Island, an average of 726.1 home improvement loans are originated for every 100,000 owner-occupied homes. For Alaska, Louisiana and Mississippi, that figure is 93.6.
- Second-lien mortgages are the most common type of mortgage used to finance home improvement loans. On average, 77.8% of new home improvement loans across the 50 states are second-lien mortgages. In other words, homeowners are more likely to choose options like home equity loans or home equity lines of credit than cash-out refinances.
- First-lien mortgages (like cash-out refinances) used for home improvements are much less common than their second-lien counterparts. On average, 22.2% of newly originated home improvement loans are first-lien. If mortgage rates fall over the coming years, the share of first-lien mortgages used for home improvements will likely increase.
- Home improvement loan amounts are highest in Hawaii, California and Massachusetts. The average home improvement loan amounts in these states are $213,373, $193,150 and $145,965, respectively. In contrast, home improvement loan amounts are lowest in Iowa, North Dakota and Nebraska, averaging $65,579, $71,460 and $72,211, respectively.
- Like loan amounts, monthly payments on home improvement loans can vary significantly by state. At $1,212, $1,137 and $1,099, average monthly payments are highest in Louisiana, Hawaii and California. They’re lowest in West Virginia, Ohio and Pennsylvania, averaging $426, $508 and $553, respectively.
- A mortgage is an agreement between a borrower and a lender that gives the lender the right to take the borrower’s home should they default on their loan.
- A first-lien, or first, mortgage is typically the loan used to purchase a home. It takes precedence over other loans secured by that house. When people refer to their “mortgage” or “mortgage payments,” they’re typically referring to a first-lien mortgage. An example of a first-lien mortgage used to pay for home improvements would be a cash-out refinance — a cash-out refinance replaces a borrower’s current first mortgage with a new one, while giving them access to extra cash they can use to pay for home improvements.
- A second-lien, or second mortgage is typically a loan secured by a home but wasn’t used to purchase that home. An example would be a home equity loan. In this case, the money comes from the equity that a homeowner has built up from their property, which is used as collateral on the loan.
States where the highest number of home improvement loans are originated for every 100,000 owner-occupied housing units
No. 1: Utah
- Number of owner-occupied housing units: 2,506,804
- Number of home improvement loans for every 100,000 owner-occupied housing units: 818.7
- Share of home improvement loans that are second-lien mortgages: 90.3%
- Share of home improvement loans that are first-lien mortgages: 9.7%
- Overall average loan amount for home improvement loans: $117,835
- Overall average monthly payment for home improvement loans: $1,063
No. 2: Idaho
- Number of owner-occupied housing units: 1,402,253
- Number of home improvement loans for every 100,000 owner-occupied housing units: 705.2
- Share of home improvement loans that are second-lien mortgages: 81.1%
- Share of home improvement loans that are first-lien mortgages: 18.9%
- Overall average loan amount for home improvement loans: $126,076
- Overall average monthly payment for home improvement loans: $1,070
No. 3: Rhode Island
- Number of owner-occupied housing units: 719,154
- Number of home improvement loans for every 100,000 owner-occupied housing units: 654.3
- Share of home improvement loans that are second-lien mortgages: 85.2%
- Share of home improvement loans that are first-lien mortgages: 14.8%
- Overall average loan amount for home improvement loans: $110,652
- Overall average monthly payment for home improvement loans: $638

States where the lowest number of home improvement loans are originated for every 100,000 owner-occupied housing units
No. 1: Alaska
- Number of owner-occupied housing units: 488,761
- Number of home improvement loans for every 100,000 owner-occupied housing units: 60.6
- Share of home improvement loans that are second-lien mortgages: 72.6%
- Share of home improvement loans that are first-lien mortgages: 27.4%
- Overall average loan amount for home improvement loans: $107,906
- Overall average monthly payment for home improvement loans: $664
No. 2: Louisiana
- Number of owner-occupied housing units: 3,139,302
- Number of home improvement loans for every 100,000 owner-occupied housing units: 106.5
- Share of home improvement loans that are second-lien mortgages: 57.2%
- Share of home improvement loans that are first-lien mortgages: 42.8%
- Overall average loan amount for home improvement loans: $129,092
- Overall average monthly payment for home improvement loans: $1,212
No. 3: Mississippi
- Number of owner-occupied housing units: 2,025,326
- Number of home improvement loans for every 100,000 owner-occupied housing units: 113.8
- Share of home improvement loans that are second-lien mortgages: 56.6%
- Share of home improvement loans that are first-lien mortgages: 43.4%
- Overall average loan amount for home improvement loans: $78,757
- Overall average monthly payment for home improvement loans: $696

Walk, don’t run, to get a home improvement loan
Loans can be helpful for many homeowners, especially those who need to tackle important home improvement projects they wouldn’t be able to easily afford with cash.
But homeowners should understand that home improvement loans aren’t without risks and potential drawbacks. In fact, defaulting on certain types of home improvement loans, like home equity loans, can result in you losing your home. And even if a lender can’t take your home because you default, the excess financial pressure a loan can put on a person can result in their credit being seriously damaged or their other bills being generally harder to deal with.
Because of this, would-be borrowers should tread carefully and thoroughly consider their options before rushing to get a loan to pay for home improvements. Don’t assume you should get a home improvement loan because you’ve got a good credit score and/or a decent amount of equity built into your house. Unless you can be reasonably certain that you’ll be able to pay back whatever you borrow without breaking your back in the process, try your best to avoid borrowing money in the first place and instead focus on paying with cash whenever you can.
At the end of the day, relying on a loan to finance home improvements can be a good idea for some. And there could even be instances where a homeowner has no choice but to use a loan to pay for something important, like fixing faulty plumbing or wiring.
Tips for tackling home improvements
Regardless of how you plan to pay for home improvements, a few things can help keep costs down. Here are three examples:
- Try to avoid letting small problems balloon. A minor issue could grow into a major expense if it’s left unattended. Regular maintenance isn’t always fun, but keeping your house in good shape can help you avoid greater expenses down the line.
- Differentiate between what you want and what you need. Though there’s nothing wrong with dreaming big when it comes to modifying your home, prioritizing essential repairs and upgrades over purely cosmetic changes can help you stay within budget, while ensuring your home remains a safe and comfortable place in which to live.
- If you need a loan, shop around for it. Numerous types of loans can be used to pay for home improvements, from home equity loans to personal loans, and each has pros and cons. Regardless of what kind of loan you choose, you may get a lower interest rate and save money by shopping around and comparing lenders.
Methodology
This study’s loan data is from the 2022 Home Mortgage Disclosure Act (HMDA). Specifically, LendingTree used HMDA data to determine the number of first- and second-lien mortgage loans used for home improvements originated in 2022 in each state. We excluded reverse mortgages and loans primarily used for business or commercial purposes.
The number of owner-occupied households figures referenced in this study are from the U.S. Census Bureau 2022 American Community Survey with one-year estimates.
Of note, our data doesn’t include home improvement loans from sources like personal loans.
View mortgage loan offers from up to 5 lenders in minutes

