Best Big Metros for Families


Where you live can impact your lifestyle, health, goals and so much more.
From proximity to support systems to career opportunities to schools, families have different priorities for where they choose to live.
We can’t say whether most families in the 50 largest U.S. metros are satisfied with those factors, but we can look at economic indicators to see where more families are thriving.
Our newest LendingTree study looks at the following seven metrics to determine the best large metros for families:
- Median income for families with children
- The percentage of children living in owned homes (rather than rented)
- The rate of children living below the poverty line
- The share of older teens (ages 16 to 19) neither currently enrolled in school nor graduated from high school (or equivalent)
- Average round-trip commute times
- The percentage of households with kids
- The average cost of child care for a 4-year-old and infant (combined)
(See our methodology for why we chose these metrics.)
Key findings
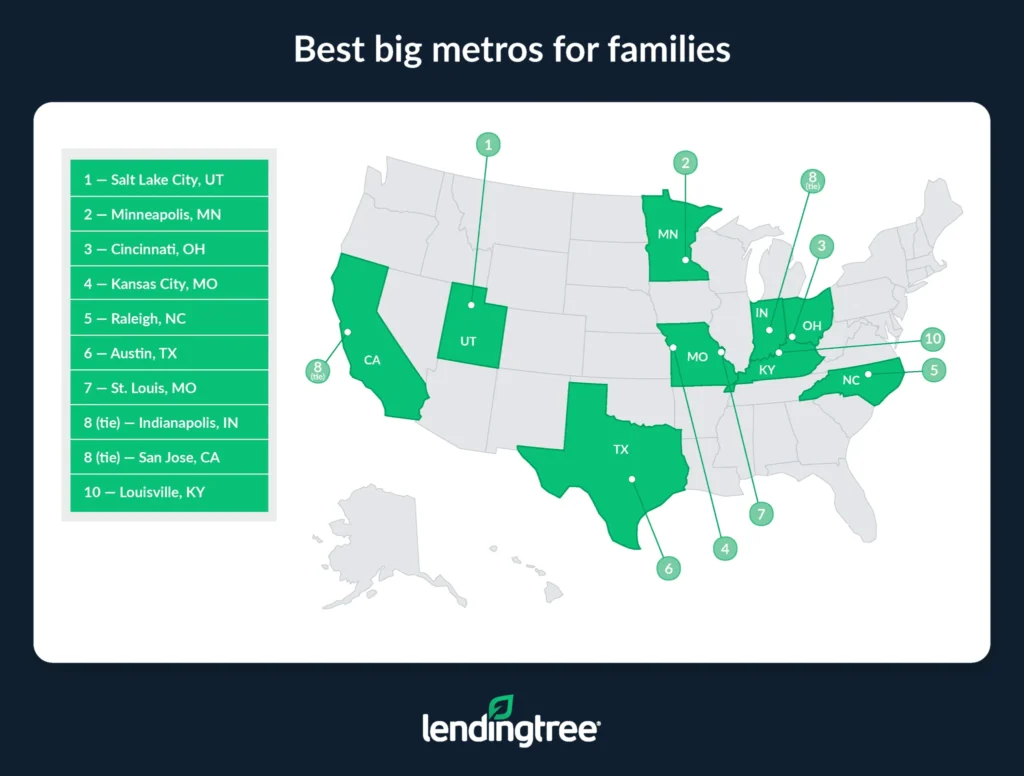
- Salt Lake City, Minneapolis and Cincinnati top our list of the best big metros for families. There’s significant diversity among metros in the top 10. For example, Louisville, Ky., is 10th despite having one of the lowest family incomes on our list, while San Jose, Calif., which finished eighth, had the highest. Meanwhile, San Jose had one of the lowest rates of kids living in owned homes, while second-place Minneapolis had the highest.
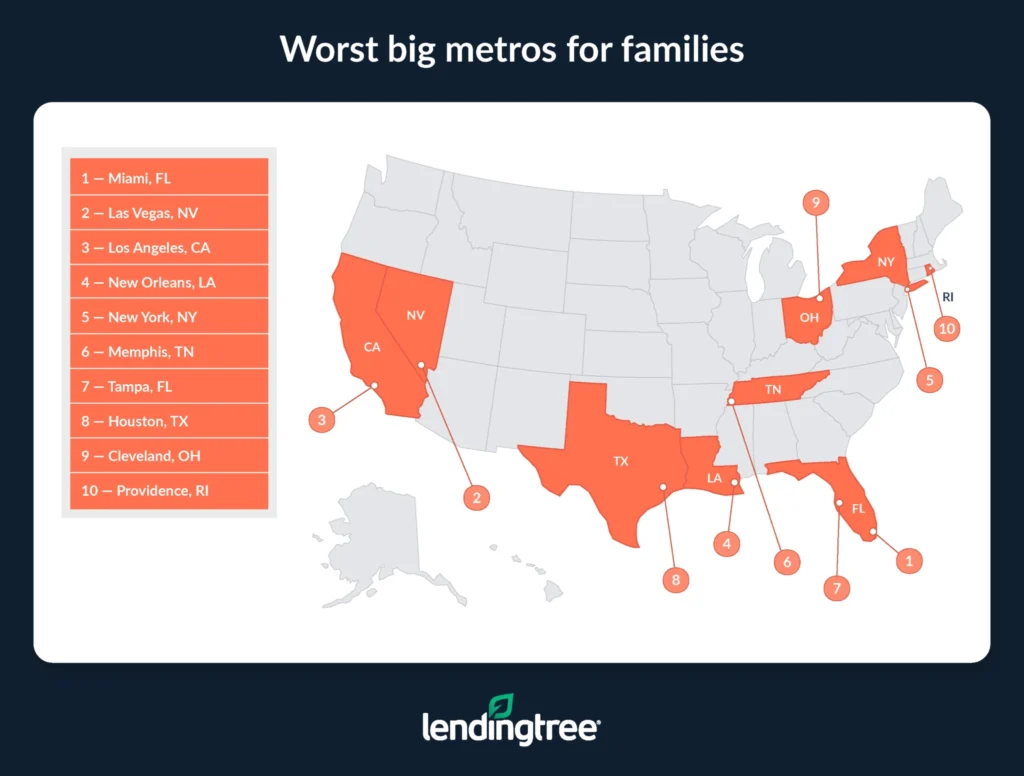
- Miami, Las Vegas and Los Angeles are at the bottom of our list of the best big metros for families. Perhaps enviable weather and vibrant cultures make up for lower family incomes, long commutes and low homeownership rates for families in these metros.
- Metros from the same states landed in divergent places. For example, Texas’ Austin landed in sixth and Houston finished 43rd, while Dallas and San Antonio were more middling at 19th and 34th, respectively. From Ohio, Cincinnati came in third, Columbus in 17th and Cleveland in 42nd. However, all four Florida metros in our analysis fell into the bottom half of our list.
Best big metros for families
No. 1: Salt Lake City
Final score: 75.4
- Median income for families with children: $112,342
- Share of children living in owner-occupied homes: 75.0%
- Share of children living below the poverty line: 10.7%
- Share of teens ages 16-19 neither in school nor with a high school or equivalent degree: 4.9%
- Average round-trip commute time: 47 minutes
- Share of households with children: 29.7%
- Average monthly child care costs for an infant and 4-year-old: $1,646
No. 2: Minneapolis
Final score: 71.8
- Median income for families with children: $132,055
- Share of children living in owner-occupied homes: 78.7%
- Share of children living below the poverty line: 8.9%
- Share of teens ages 16-19 neither in school nor with a high school or equivalent degree: 2.5%
- Average round-trip commute time: 48 minutes
- Share of households with children: 26.8%
- Average monthly child care costs for an infant and 4-year-old: $3,131
No. 3: Cincinnati
Final score: 68.8
- Median income for families with children: $106,971
- Share of children living in owner-occupied homes: 73.3%
- Share of children living below the poverty line: 13.0%
- Share of teens ages 16-19 neither in school nor with a high school or equivalent degree: 2.5%
- Average round-trip commute time: 48 minutes
- Share of households with children: 26.1%
- Average monthly child care costs for an infant and 4-year-old: $1,868
Worst big metros for families
No. 1: Miami
Final score: 23.4
- Median income for families with children: $84,550
- Share of children living in owner-occupied homes: 57.6%
- Share of children living below the poverty line: 16.1%
- Share of teens ages 16-19 neither in school nor with a high school or equivalent degree: 4.2%
- Average round-trip commute time: 59 minutes
- Share of households with children: 24.5%
- Average monthly child care costs for an infant and 4-year-old: $1,982
No. 2: Las Vegas
Final score: 24.0
- Median income for families with children: $79,397
- Share of children living in owner-occupied homes: 53.1%
- Share of children living below the poverty line: 17.7%
- Share of teens ages 16-19 neither in school nor with a high school or equivalent degree: 5.6%
- Average round-trip commute time: 52 minutes
- Share of households with children: 24.6%
- Average monthly child care costs for an infant and 4-year-old: $1,998
No. 3: Los Angeles
Final score: 28.0
- Median income for families with children: $100,832
- Share of children living in owner-occupied homes: 48.3%
- Share of children living below the poverty line: 15.9%
- Share of teens ages 16-19 neither in school nor with a high school or equivalent degree: 2.6%
- Average round-trip commute time: 61 minutes
- Share of households with children: 25.0%
- Average monthly child care costs for an infant and 4-year-old: $2,844
Full rankings
| Rank | Metro | Final score | Median income for families with kids | % of kids in owner-occupied homes | % of kids living below poverty level | % of older teens not in school nor graduated | Avg. round-trip commute time (minutes) | % of households with kids | Avg. monthly child care costs for 2 kids* |
|---|---|---|---|---|---|---|---|---|---|
| 1 | Salt Lake City, UT | 75.4 | $112,342 | 75.0% | 10.7% | 4.9% | 47 | 29.7% | $1,646 |
| 2 | Minneapolis, MN | 71.8 | $132,055 | 78.7% | 8.9% | 2.5% | 48 | 26.8% | $3,131 |
| 3 | Cincinnati, OH | 68.8 | $106,971 | 73.3% | 13.0% | 2.5% | 48 | 26.1% | $1,868 |
| 4 | Kansas City, MO | 68.6 | $103,180 | 72.4% | 10.6% | 3.8% | 47 | 27.0% | $1,903 |
| 5 | Raleigh, NC | 68.2 | $129,979 | 73.9% | 9.0% | 4.6% | 53 | 29.5% | $1,955 |
| 6 | Austin, TX | 67.8 | $133,266 | 71.0% | 10.6% | 2.8% | 54 | 26.0% | $1,770 |
| 7 | St. Louis, MO | 64.6 | $107,086 | 74.2% | 13.0% | 2.5% | 50 | 25.1% | $1,998 |
| 8 | Indianapolis, IN | 60.2 | $102,418 | 71.1% | 13.3% | 3.2% | 51 | 27.4% | $1,970 |
| 8 | San Jose, CA | 60.2 | $205,285 | 52.8% | 7.5% | 2.3% | 55 | 28.2% | $2,899 |
| 10 | Louisville, KY | 58.2 | $86,595 | 71.5% | 18.1% | 2.0% | 49 | 25.4% | $1,567 |
| 11 | San Diego, CA | 58.0 | $124,977 | 54.5% | 11.4% | 1.4% | 51 | 27.2% | $2,879 |
| 12 | Philadelphia, PA | 56.8 | $112,892 | 74.0% | 14.5% | 2.4% | 59 | 25.6% | $2,319 |
| 13 | Portland, OR | 55.8 | $115,488 | 70.1% | 8.6% | 4.1% | 50 | 25.4% | $2,680 |
| 14 | Richmond, VA | 54.6 | $107,986 | 66.7% | 13.2% | 2.9% | 51 | 26.1% | $2,389 |
| 15 | Baltimore, MD | 54.0 | $121,321 | 69.0% | 10.7% | 2.5% | 59 | 25.4% | $2,656 |
| 15 | Washington, DC | 54.0 | $150,973 | 67.8% | 9.0% | 2.9% | 65 | 28.1% | $3,773 |
| 17 | Columbus, OH | 53.4 | $103,244 | 63.3% | 16.1% | 3.2% | 48 | 26.9% | $1,878 |
| 17 | Pittsburgh, PA | 53.4 | $101,054 | 74.9% | 15.3% | 1.9% | 52 | 21.8% | $2,162 |
| 19 | Dallas, TX | 52.2 | $103,050 | 64.6% | 13.3% | 4.0% | 57 | 30.5% | $1,854 |
| 20 | Atlanta, GA | 51.2 | $104,145 | 68.5% | 14.8% | 3.9% | 63 | 27.6% | $1,782 |
| 20 | Birmingham, AL | 51.2 | $90,871 | 72.4% | 18.4% | 3.4% | 55 | 26.3% | $1,468 |
| 20 | Milwaukee, WI | 51.2 | $103,582 | 66.8% | 16.3% | 2.6% | 46 | 24.3% | $2,116 |
| 23 | Sacramento, CA | 50.6 | $114,083 | 62.5% | 11.0% | 3.9% | 55 | 28.6% | $2,763 |
| 24 | Nashville, TN | 50.2 | $104,100 | 66.4% | 13.1% | 3.7% | 57 | 26.3% | $1,962 |
| 25 | Boston, MA | 49.8 | $153,289 | 70.3% | 9.6% | 2.6% | 62 | 24.6% | $3,648 |
| 25 | Orlando, FL | 49.8 | $92,650 | 62.2% | 13.1% | 2.7% | 59 | 26.9% | $1,785 |
| 27 | Charlotte, NC | 49.2 | $102,166 | 67.1% | 15.0% | 4.5% | 55 | 27.8% | $1,925 |
| 27 | Chicago, IL | 49.2 | $111,513 | 71.3% | 14.2% | 2.5% | 61 | 25.0% | $2,466 |
| 27 | Seattle, WA | 49.2 | $143,090 | 65.7% | 11.1% | 3.1% | 58 | 26.3% | $3,114 |
| 30 | San Francisco, CA | 48.6 | $175,050 | 59.5% | 8.9% | 2.2% | 63 | 25.1% | $2,964 |
| 31 | Oklahoma City, OK | 47.8 | $89,246 | 66.3% | 18.7% | 5.3% | 48 | 27.5% | $1,587 |
| 32 | Denver, CO | 44.2 | $133,980 | 69.6% | 11.3% | 5.2% | 55 | 24.6% | $2,921 |
| 32 | Fresno, CA | 44.2 | $70,468 | 52.7% | 24.1% | 2.3% | 47 | 33.4% | $2,645 |
| 34 | San Antonio, TX | 44.0 | $88,685 | 66.6% | 18.0% | 4.7% | 55 | 28.0% | $1,703 |
| 35 | Jacksonville, FL | 42.6 | $88,445 | 65.0% | 14.6% | 4.5% | 53 | 25.6% | $1,751 |
| 36 | Virginia Beach, VA | 41.4 | $86,130 | 61.0% | 15.8% | 2.8% | 50 | 26.6% | $2,396 |
| 37 | Riverside, CA | 40.8 | $89,459 | 60.7% | 15.7% | 2.3% | 66 | 32.7% | $2,675 |
| 38 | Buffalo, NY | 40.6 | $92,838 | 68.9% | 19.0% | 3.7% | 44 | 22.8% | $2,618 |
| 39 | Detroit, MI | 40.0 | $94,158 | 73.9% | 19.3% | 4.1% | 53 | 24.0% | $1,979 |
| 39 | Phoenix, AZ | 40.0 | $99,659 | 65.7% | 13.3% | 5.2% | 53 | 26.0% | $2,159 |
| 41 | Providence, RI | 38.2 | $100,425 | 65.4% | 15.7% | 2.7% | 54 | 24.2% | $2,606 |
| 42 | Cleveland, OH | 38.0 | $90,503 | 68.5% | 19.9% | 4.9% | 47 | 22.2% | $1,860 |
| 43 | Houston, TX | 37.8 | $89,911 | 64.0% | 19.3% | 5.2% | 61 | 31.7% | $1,770 |
| 44 | Tampa, FL | 36.6 | $91,953 | 66.2% | 14.0% | 4.2% | 59 | 22.5% | $1,772 |
| 45 | Memphis, TN | 36.2 | $72,037 | 52.7% | 25.8% | 3.7% | 49 | 26.7% | $1,865 |
| 46 | New York, NY | 35.2 | $117,668 | 54.6% | 16.6% | 2.1% | 72 | 25.5% | $3,151 |
| 47 | New Orleans, LA | 28.6 | $76,946 | 61.0% | 25.3% | 6.8% | 49 | 22.2% | $1,660 |
| 48 | Los Angeles, CA | 28.0 | $100,832 | 48.3% | 15.9% | 2.6% | 61 | 25.0% | $2,844 |
| 49 | Las Vegas, NV | 24.0 | $79,397 | 53.1% | 17.7% | 5.6% | 52 | 24.6% | $1,998 |
| 50 | Miami, FL | 23.4 | $84,550 | 57.6% | 16.1% | 4.2% | 59 | 24.5% | $1,982 |
Tips for finding an affordable family home
Whether you plan to raise a family in one of these large metros, finding and purchasing the right home affordably is more challenging than ever. This is thanks to rising home prices and interest rates and, in some places, soaring insurance costs and loss of housing due to ecological disasters. There are, however, a few ways to decrease those costs.
- Shop around to get your lowest possible rate on a mortgage. By shopping around for a mortgage before choosing a lender, you can increase your odds of finding a lower rate on your loan. The lower your rate, the more money you could save each month on housing payments and the more cash you could have left for family-related expenses.
- Use home equity to remodel your current place. If you’ve found your family has seemingly outgrown your home, it doesn’t mean you need to consider a move. Instead, tapping into your home’s equity could help you afford renovations that make your home more suitable for your family. For example, a home equity loan can help you transform an office into a nursery or a half-bathroom into a full one.
- Consider renting.Though our study emphasizes homeownership, renting can be a good option for many households. This is especially true when considering that renting is usually considerably cheaper than owning.
Methodology
LendingTree researchers used data from the U.S. Census Bureau 2023 American Community Survey with one-year estimates to score and rank the 50 largest U.S. metros by population.
Each metro was ranked on each variable, and then these ranks were averaged at equal weight. That final average was scored on a scale of 100, meaning that the highest possible score was 100 and the lowest was one.
The following metrics were chosen for the following reasons:
- Median income for families with children: Higher incomes generally indicate better economic opportunities for parents and caretakers of children.
- Share of children living in owner-occupied homes: Many consider homeownership to be part of the American dream, often providing intergenerational wealth and a sense of stability to families.
- Share of children living below the poverty line: Poverty is an unfortunate reality for a shocking number of American children. Higher rates imply less opportunity for families to securely support their children financially.
- Share of teens ages 16-19 neither in school nor with a high school or equivalent degree: Adults without a high school or equivalent degree generally suffer economic stress and are generally not eligible for additional education and training required to get a leg up in the world. While any number of factors may lead someone to drop out of school, a higher-than-usual rate may point to structural challenges, including in the schools themselves.
- Average round-trip commute time: A longer commute means more time away from one’s children, as well as less time to do care activities, such as preparing healthier meals and helping with homework. Research has also consistently shown inverse correlations between longer commutes and well-being.
- Share of households with children: Besides increased recreational and social opportunities for kids when there are more kids around, parents tend to move to or stay in places that work for their lifestyles.
- Average monthly child care costs for an infant and 4-year-old: Child care is incredibly expensive, and sometimes even hard to find.
View mortgage loan offers from up to 5 lenders in minutes