Renting Is Cheaper Than Owning in Every Large Metro


Making the decision to buy a home can be challenging. Down payments are a significant financial hurdle for many consumers — and that’s not where the costs end. In fact, U.S. homeowners with a mortgage pay 36.9% more a month than renters, according to our study.
Here’s a closer look at where those gaps are largest.
Key findings
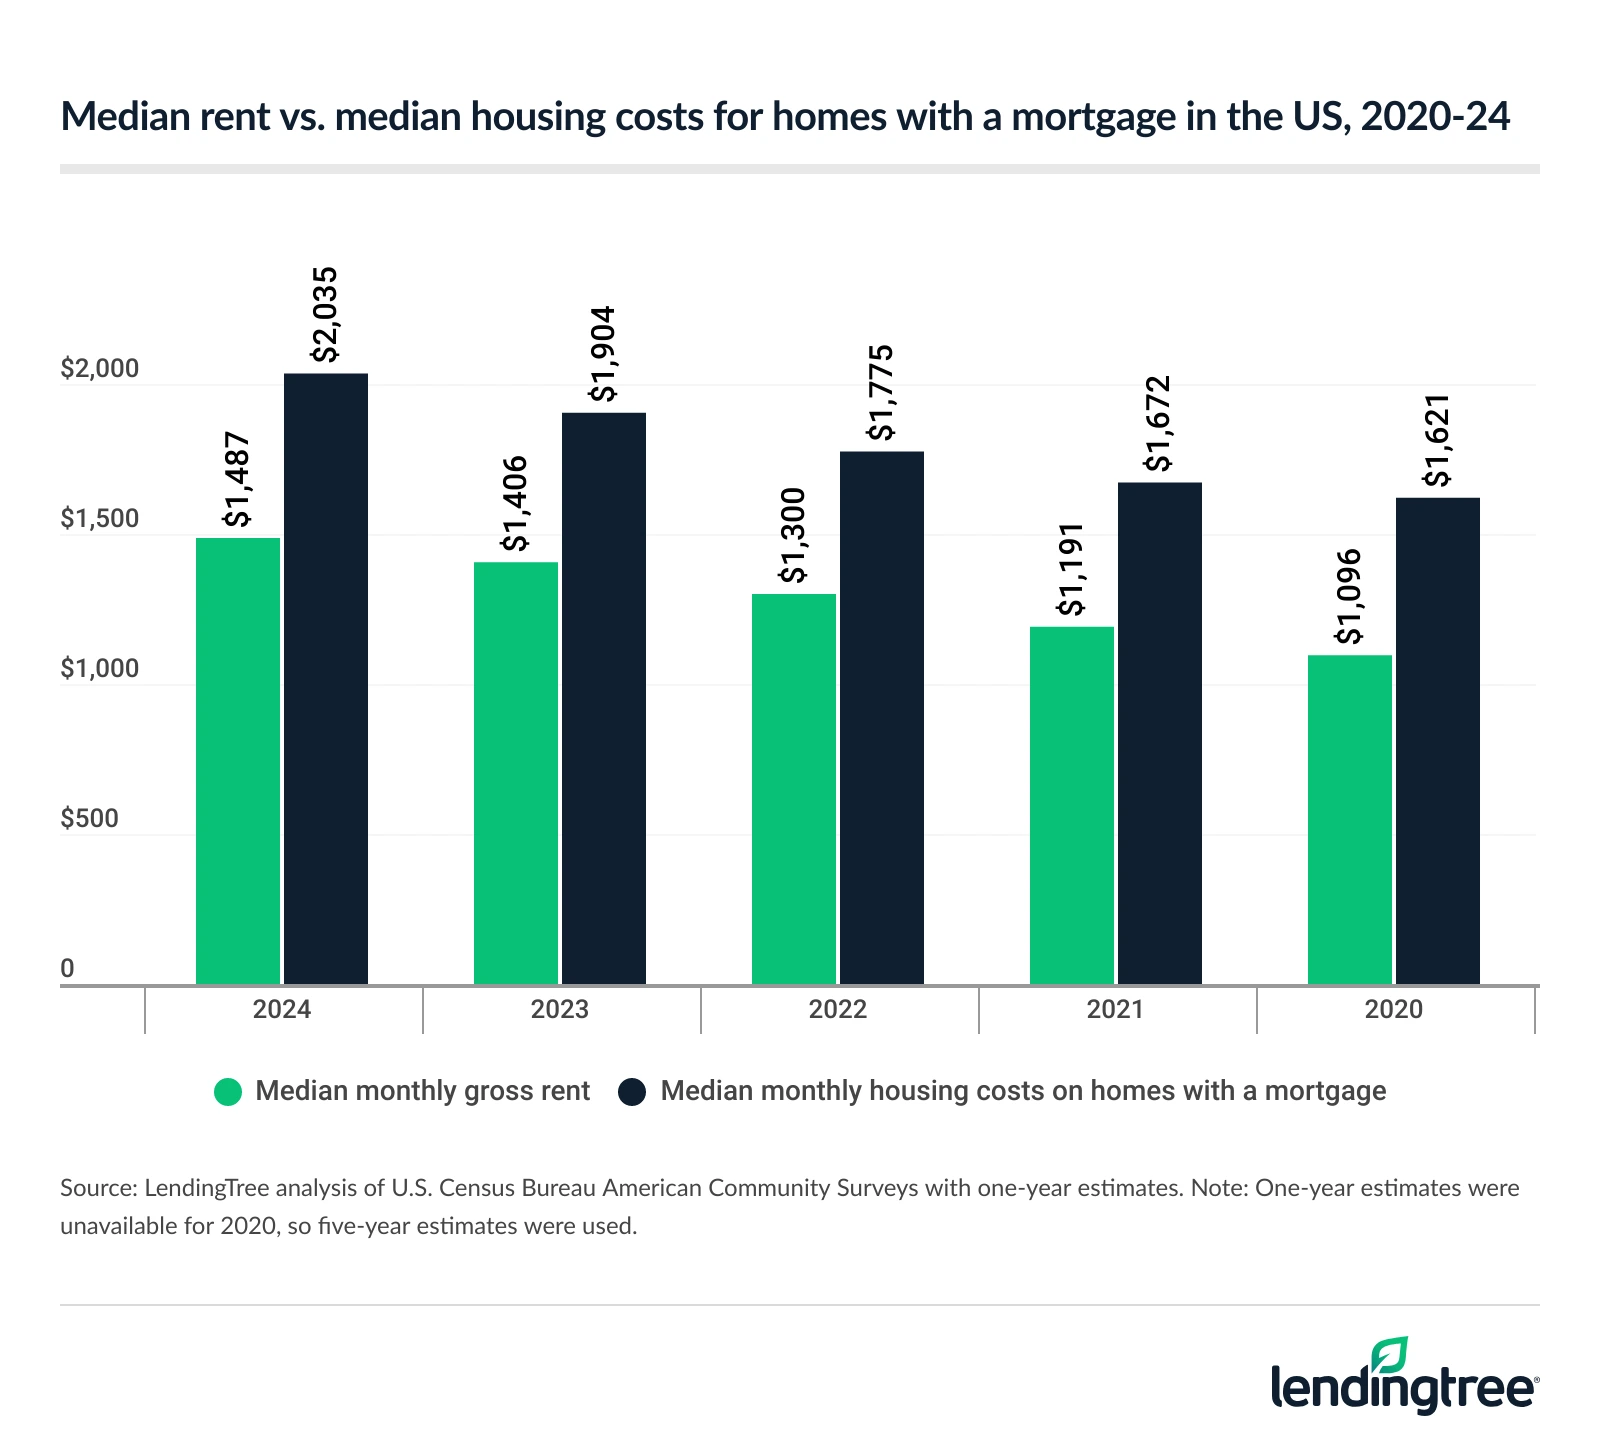
- U.S. homeowners with a mortgage pay 36.9% more a month than renters. The median monthly gross rent was $1,487 in 2024, versus $2,035 for median monthly housing costs on homes with a mortgage. This represents a monthly gap of $548, or $6,576 annually. That monthly gap is $50 more than it was in 2023, when the difference was $498.
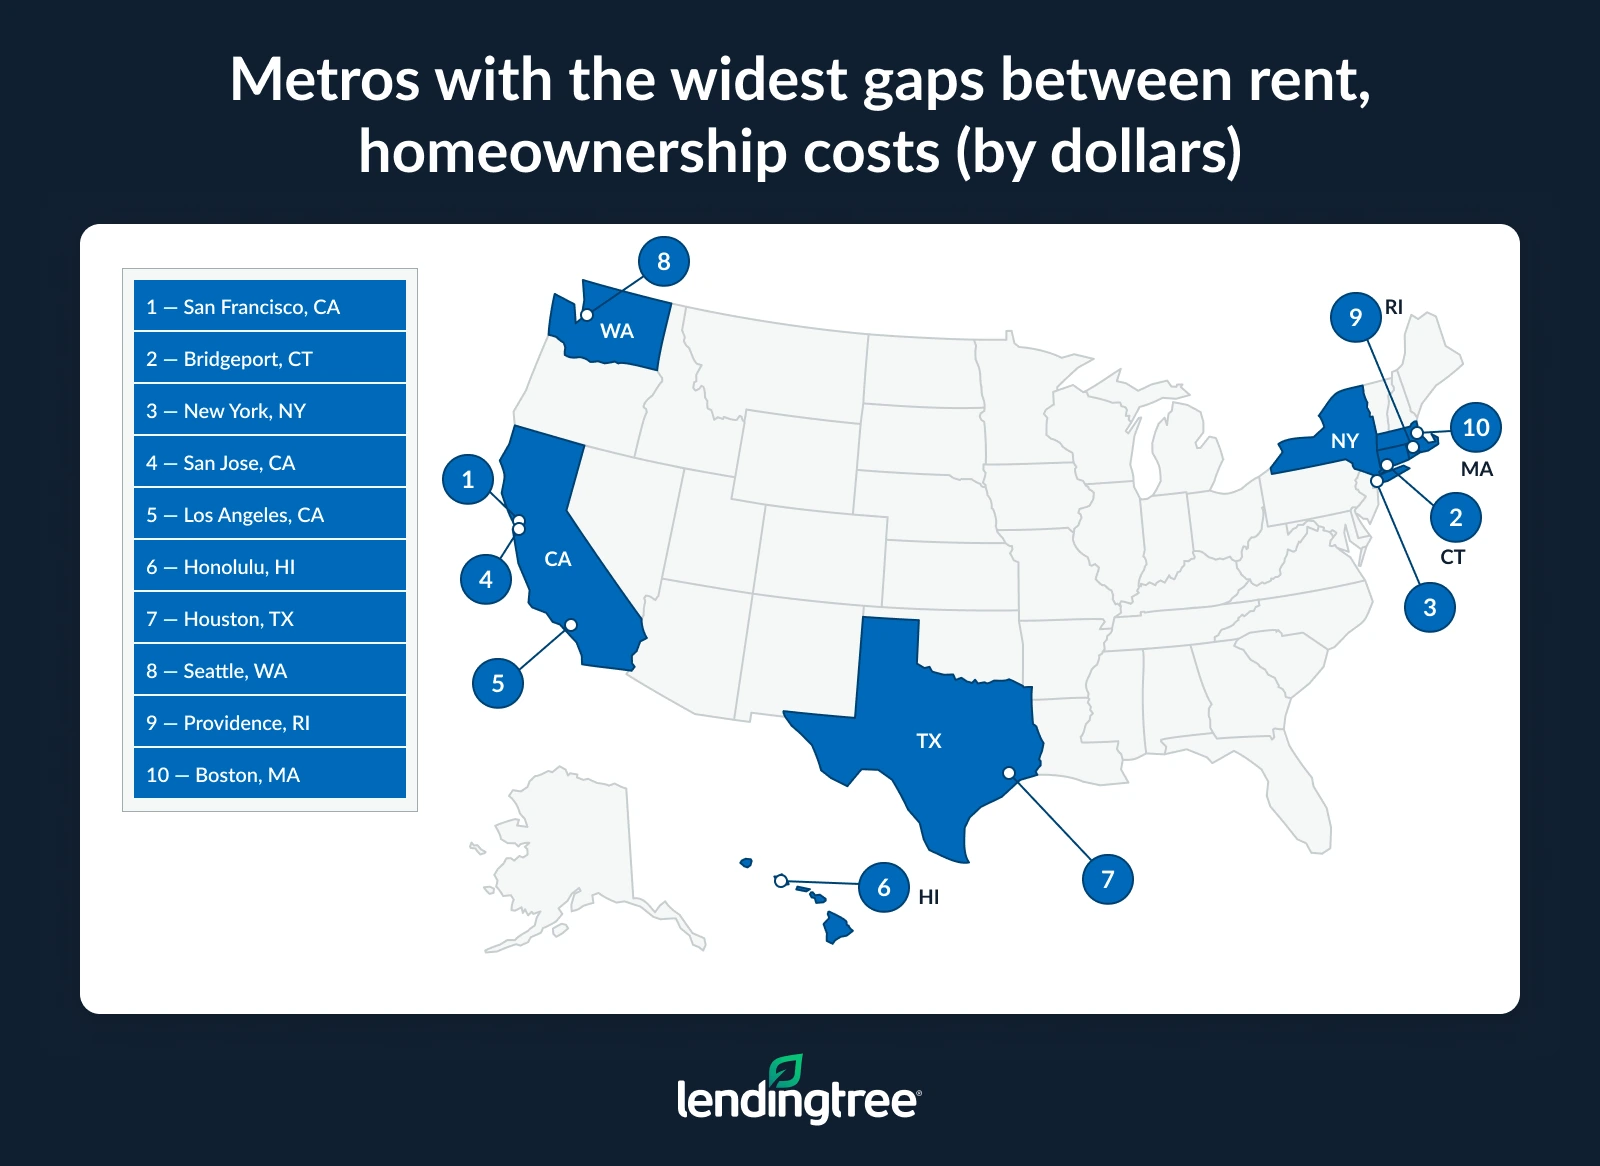
- Among the 100 largest metros, San Francisco has the largest cost difference between renting and owning with a mortgage. The gap there is $1,565. Bridgeport, Conn. ($1,427), and New York ($1,409) follow.
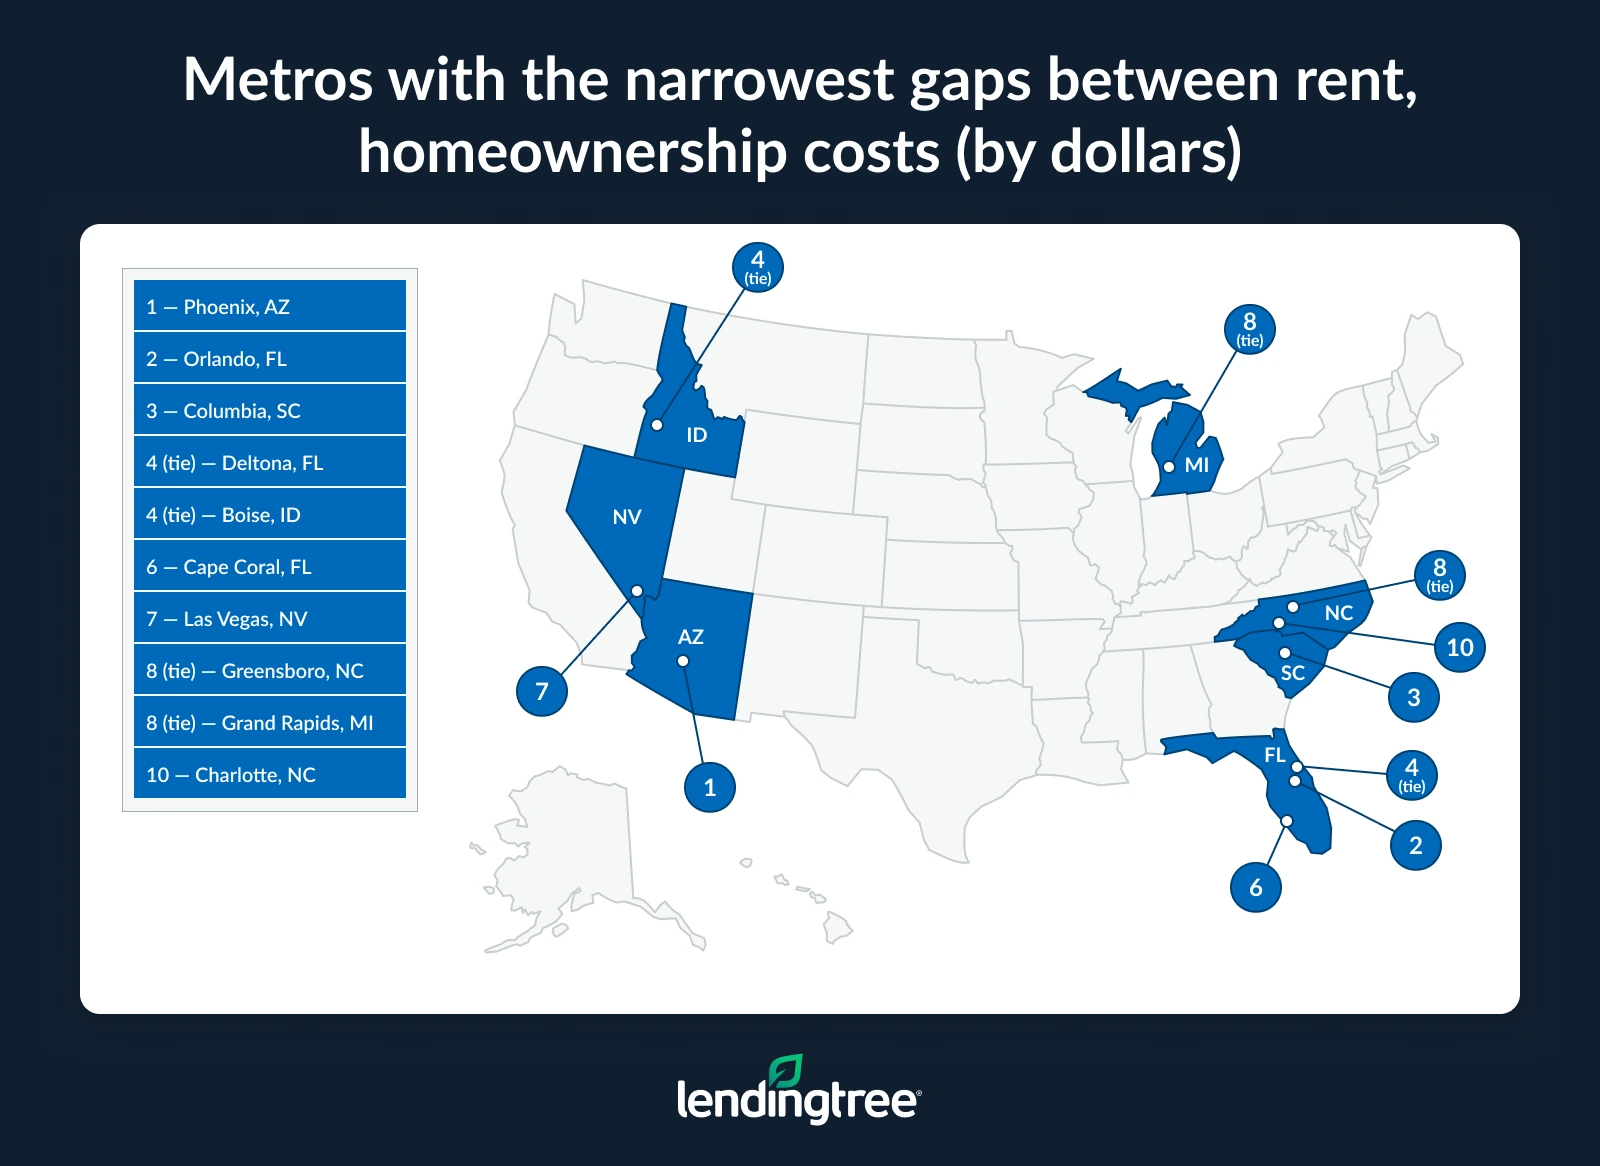
- Still, renting is cheaper than owning a home with a mortgage in every large metro. Even in the metros where the differences are smallest — Phoenix, Orlando, Fla., and Columbia, S.C. — renters pay $184, $257 and $271 less a month, respectively, than those with a mortgage.
- The percentage gap in costs between renters and homeowners with a mortgage is widest in New York, Bridgeport and Providence, R.I. The gaps are 76.1%, 75.3% and 66.5%, respectively. In 22 of the 100 largest metros, homeowners with a mortgage pay at least 50.0% more a month than renters.
Homeowners pay 36.9% more than renters
U.S. homeowners with a mortgage pay 36.9% more a month than renters.
Breaking that down, the median monthly gross rent was $1,487 in 2024, while the median monthly housing costs for those with a mortgage were $2,035. That’s a gap of $548 a month, or $6,576 annually.
In 2023, the difference was $498 a month — $50 less than in 2024.
Over the past five years, the monthly gap between renting and owning with a mortgage was highest in 2024 at $548 a month and lowest in 2022 at $475. From 2023 to 2024, median rent rose 5.8%, while homeownership costs with a mortgage increased 6.9%.
With that in mind, Matt Schulz, LendingTree chief consumer finance analyst and author of “Ask Questions, Save Money, Make More: How to Take Control of Your Financial Life,” says there’s no universal answer to whether it’s better to rent or own.
“The choice isn’t just about money,” he says. “Homebuying can represent accomplishment, security, safety and plenty of other things. There’s a reason why homeownership has long been considered part of the American Dream. That said, owning can make financial sense depending on your goals.”
Homeownership has traditionally been one of the best ways for people to build wealth. While the math on that has certainly been complicated by high housing prices and interest rates, it can still serve that purpose. “Also, the equity you can build in a home you own can provide valuable financing options in the future for things like a home remodel, starting a business or knocking down high-interest debt,” Schulz says. “To reap all of these benefits, you likely need to stay in the home for more than a few years. But it can pay off if that’s your plan.”
San Francisco has largest cost gap
By metro, San Francisco has the largest cost difference between renting and owning with a mortgage. While the median rent is $2,435, the median housing costs are $4,000-plus. (Note: Median housing costs above $4,000 are recorded as “$4,000-plus” by the Census Bureau. We used $4,000 to determine the cost difference between renting and owning.) That’s a gap of $1,565.
Bridgeport, Conn. ($1,427), ranks second, with renters paying $1,895 a month and homeowners with mortgages paying $3,322. New York ($1,409) rounds out the top three, with a median rent of $1,851 and median housing costs of $3,260.
With those high cost differences in mind, Schulz says there’s no question that people are delaying buying homes because of high mortgage rates and prices. “People are waiting longer to buy their first home,” he says. “They’re choosing not to buy a new home because they’re reluctant to trade their current low-rate mortgage for one at today’s higher rates. Some people are even becoming resigned to the fact that they’ll never be able to own a home. That sort of decision has massive ramifications, not just for individuals but for the economy as a whole. Unfortunately, however, that doesn’t seem likely to change anytime soon.”
Overall, renting is cheaper than owning a home with a mortgage in every metro analyzed. Phoenix has the smallest cost gap — renters there pay $1,819 a month, while homeowners with mortgages pay $2,003. That’s a difference of $184.
Orlando, Fla. ($257), and Columbia, S.C. ($271), follow.
Full rankings: Metros where homeowners pay most per month compared to renters (by dollars)
| Rank | Metro | Median rent | Median housing costs for homes with a mortgage | Difference ($) |
|---|---|---|---|---|
| 1 | San Francisco, CA | $2,435 | $4,000+ | $1,565 |
| 2 | Bridgeport, CT | $1,895 | $3,322 | $1,427 |
| 3 | New York, NY | $1,851 | $3,260 | $1,409 |
| 4 | San Jose, CA | $2,827 | $4,000+ | $1,173 |
| 5 | Los Angeles, CA | $2,114 | $3,255 | $1,141 |
| 6 | Honolulu, HI | $2,001 | $3,093 | $1,092 |
| 7 | Houston, TX | $1,469 | $2,433 | $964 |
| 8 | Seattle, WA | $2,050 | $2,989 | $939 |
| 9 | Providence, RI | $1,396 | $2,324 | $928 |
| 10 | Boston, MA | $2,093 | $3,005 | $912 |
| 11 | San Diego, CA | $2,336 | $3,243 | $907 |
| 12 | Hartford, CT | $1,458 | $2,352 | $894 |
| 13 | Worcester, MA | $1,563 | $2,432 | $869 |
| 14 | Stockton, CA | $1,788 | $2,634 | $846 |
| 14 | Kiryas Joel, NY | $1,688 | $2,534 | $846 |
| 16 | Oxnard, CA | $2,313 | $3,150 | $837 |
| 17 | Austin, TX | $1,784 | $2,610 | $826 |
| 18 | Washington, DC | $2,037 | $2,850 | $813 |
| 19 | Dallas, TX | $1,718 | $2,491 | $773 |
| 20 | Sacramento, CA | $1,904 | $2,674 | $770 |
| 21 | Chicago, IL | $1,469 | $2,237 | $768 |
| 22 | New Haven, CT | $1,600 | $2,358 | $758 |
| 23 | Minneapolis, MN | $1,444 | $2,182 | $738 |
| 23 | Denver, CO | $1,943 | $2,681 | $738 |
| 25 | Portland, OR | $1,767 | $2,492 | $725 |
| 26 | New Orleans, LA | $1,262 | $1,972 | $710 |
| 27 | Omaha, NE | $1,230 | $1,922 | $692 |
| 28 | Madison, WI | $1,437 | $2,118 | $681 |
| 29 | Milwaukee, WI | $1,177 | $1,849 | $672 |
| 30 | Provo, UT | $1,611 | $2,282 | $671 |
| 31 | Albany, NY | $1,341 | $2,011 | $670 |
| 32 | Fresno, CA | $1,513 | $2,166 | $653 |
| 33 | Baltimore, MD | $1,633 | $2,278 | $645 |
| 34 | Philadelphia, PA | $1,567 | $2,199 | $632 |
| 35 | Kansas City, MO | $1,315 | $1,945 | $630 |
| 36 | Wichita, KS | $1,010 | $1,636 | $626 |
| 37 | Oklahoma City, OK | $1,162 | $1,767 | $605 |
| 38 | Des Moines, IA | $1,178 | $1,780 | $602 |
| 39 | San Antonio, TX | $1,422 | $2,023 | $601 |
| 40 | McAllen, TX | $971 | $1,566 | $595 |
| 41 | Baton Rouge, LA | $1,138 | $1,725 | $587 |
| 42 | Miami, FL | $2,083 | $2,664 | $581 |
| 42 | Tulsa, OK | $1,115 | $1,696 | $581 |
| 44 | St. Louis, MO | $1,154 | $1,720 | $566 |
| 45 | Colorado Springs, CO | $1,761 | $2,321 | $560 |
| 46 | Salt Lake City, UT | $1,659 | $2,213 | $554 |
| 47 | Spokane, WA | $1,405 | $1,953 | $548 |
| 48 | Columbus, OH | $1,359 | $1,905 | $546 |
| 49 | Riverside, CA | $2,006 | $2,546 | $540 |
| 50 | Pittsburgh, PA | $1,083 | $1,619 | $536 |
| 51 | Syracuse, NY | $1,114 | $1,641 | $527 |
| 52 | Cincinnati, OH | $1,203 | $1,721 | $518 |
| 53 | Bakersfield, CA | $1,479 | $1,996 | $517 |
| 54 | Fayetteville, AR | $1,222 | $1,736 | $514 |
| 55 | Rochester, NY | $1,172 | $1,682 | $510 |
| 56 | Harrisburg, PA | $1,254 | $1,755 | $501 |
| 57 | El Paso, TX | $1,081 | $1,575 | $494 |
| 58 | Allentown, PA | $1,458 | $1,947 | $489 |
| 59 | Cleveland, OH | $1,087 | $1,570 | $483 |
| 60 | Buffalo, NY | $1,114 | $1,593 | $479 |
| 61 | Detroit, MI | $1,248 | $1,718 | $470 |
| 61 | Raleigh, NC | $1,674 | $2,144 | $470 |
| 63 | Virginia Beach, VA | $1,556 | $2,023 | $467 |
| 64 | Winston-Salem, NC | $1,102 | $1,566 | $464 |
| 64 | Akron, OH | $1,059 | $1,523 | $464 |
| 66 | Toledo, OH | $949 | $1,401 | $452 |
| 67 | Jacksonville, FL | $1,625 | $2,076 | $451 |
| 68 | Albuquerque, NM | $1,220 | $1,670 | $450 |
| 69 | Louisville, KY | $1,140 | $1,586 | $446 |
| 70 | Tucson, AZ | $1,300 | $1,744 | $444 |
| 71 | Indianapolis, IN | $1,273 | $1,707 | $434 |
| 72 | Augusta, GA | $1,243 | $1,669 | $426 |
| 72 | Jackson, MS | $1,100 | $1,526 | $426 |
| 74 | Lakeland, FL | $1,484 | $1,904 | $420 |
| 75 | Durham, NC | $1,598 | $2,006 | $408 |
| 76 | Ogden, UT | $1,641 | $2,046 | $405 |
| 77 | Birmingham, AL | $1,262 | $1,666 | $404 |
| 78 | Little Rock, AR | $1,093 | $1,489 | $396 |
| 79 | Knoxville, TN | $1,219 | $1,611 | $392 |
| 80 | Dayton, OH | $1,119 | $1,505 | $386 |
| 81 | Tampa, FL | $1,776 | $2,143 | $367 |
| 82 | Chattanooga, TN | $1,265 | $1,631 | $366 |
| 83 | Memphis, TN | $1,330 | $1,691 | $361 |
| 84 | Charleston, SC | $1,714 | $2,072 | $358 |
| 85 | Atlanta, GA | $1,770 | $2,127 | $357 |
| 86 | Richmond, VA | $1,546 | $1,897 | $351 |
| 87 | North Port, FL | $1,920 | $2,261 | $341 |
| 88 | Nashville, TN | $1,627 | $1,962 | $335 |
| 89 | Palm Bay, FL | $1,681 | $2,014 | $333 |
| 90 | Greenville, SC | $1,236 | $1,560 | $324 |
| 91 | Charlotte, NC | $1,594 | $1,914 | $320 |
| 92 | Grand Rapids, MI | $1,289 | $1,607 | $318 |
| 92 | Greensboro, NC | $1,171 | $1,489 | $318 |
| 94 | Las Vegas, NV | $1,739 | $2,025 | $286 |
| 95 | Cape Coral, FL | $1,871 | $2,149 | $278 |
| 96 | Boise, ID | $1,628 | $1,900 | $272 |
| 96 | Deltona, FL | $1,614 | $1,886 | $272 |
| 98 | Columbia, SC | $1,257 | $1,528 | $271 |
| 99 | Orlando, FL | $1,877 | $2,134 | $257 |
| 100 | Phoenix, AZ | $1,819 | $2,003 | $184 |
New York has largest percentage gap
By the biggest percentage difference between renting and owning, New York ranks first. Here, homeowners with mortgages pay 76.1% more a month than renters. Bridgeport, Conn. (75.3%), and Providence, R.I (66.5%), follow.
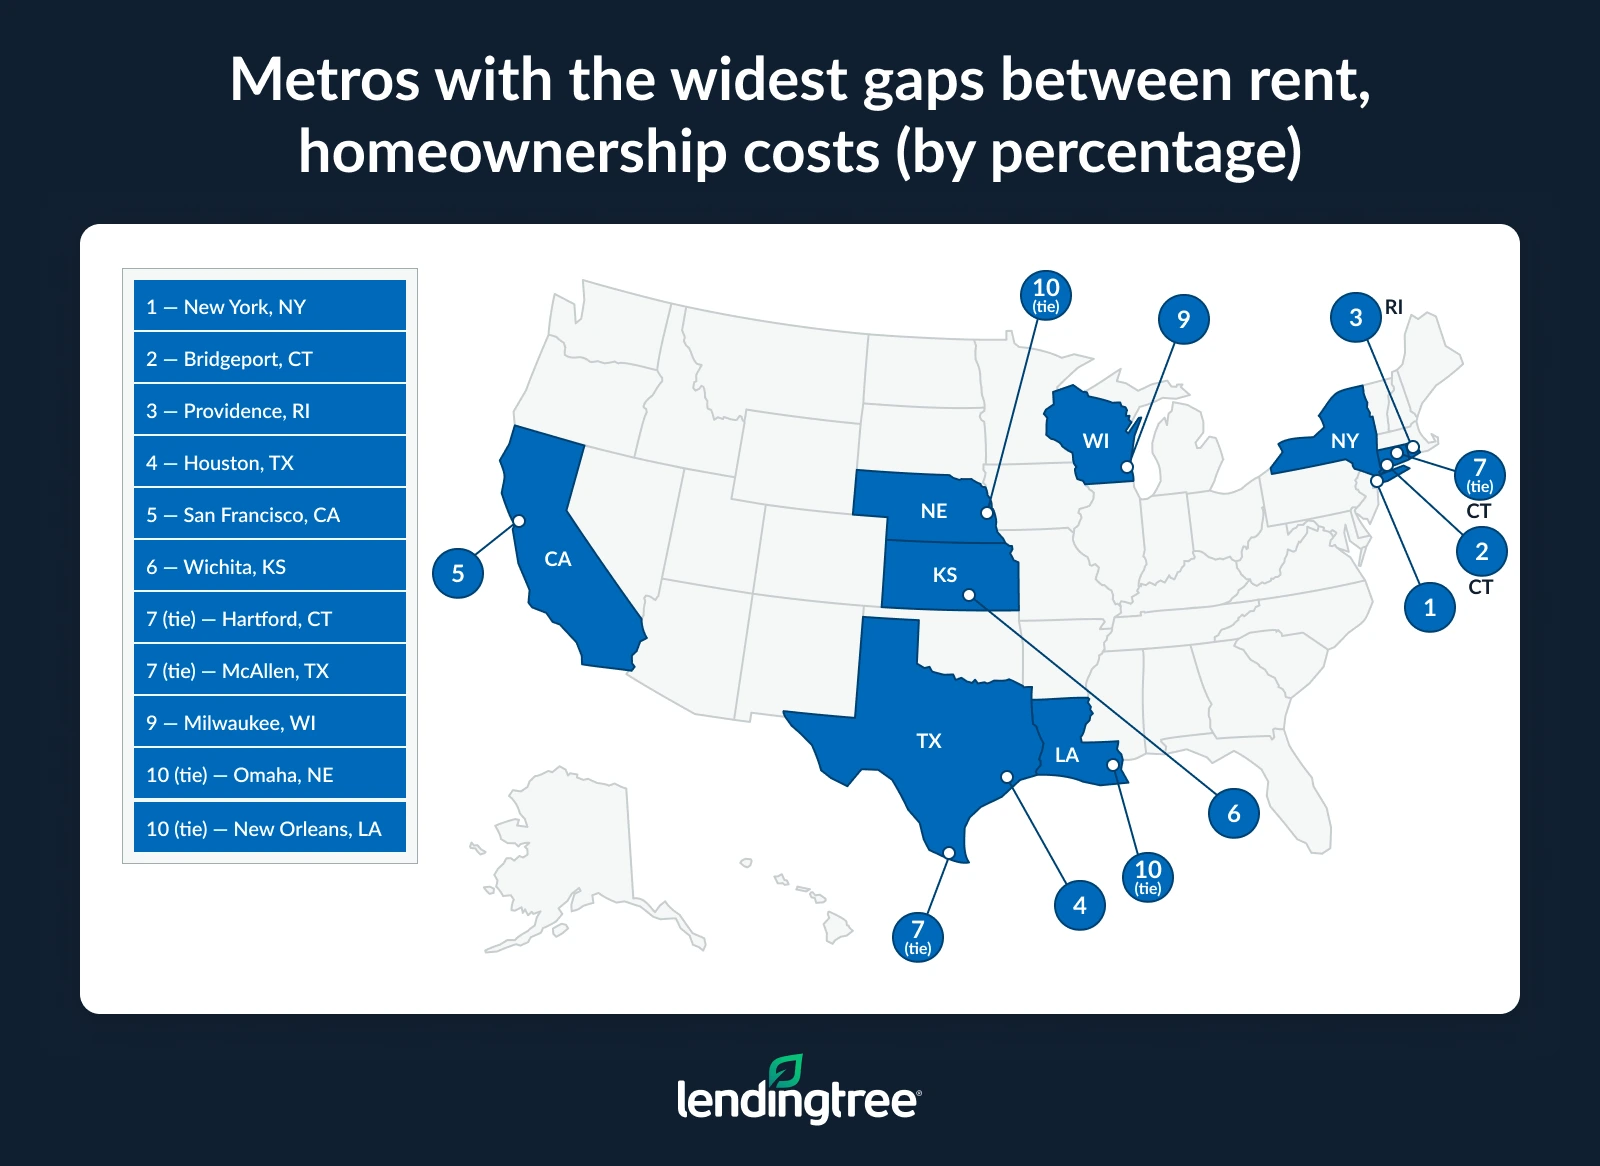
In total, homeowners with a mortgage pay at least 50.0% more a month than renters in 22 of the 100 largest metros.
Schulz acknowledges that those figures may be discouraging.
“That could be enough to convince someone that they’ll never be able to own a home in those areas, and — unfortunately — they may be right,” he says. “When it costs so much more to own than to rent, it forces people who want to own a home to face some tough decisions, including potentially having to relocate to another location in search of reasonably priced property.”
Conversely, Phoenix homeowners with mortgages have the smallest percentage gap in costs. Here, they pay 10.1% more a month than renters. Two Florida metros follow: Orlando (13.7%) and Cape Coral (14.9%).
Full rankings: Metros where homeowners pay most per month compared to renters (by percentage)
| Rank | Metro | Median rent | Median housing costs for homes with a mortgage | Difference (%) |
|---|---|---|---|---|
| 1 | New York, NY | $1,851 | $3,260 | 76.1% |
| 2 | Bridgeport, CT | $1,895 | $3,322 | 75.3% |
| 3 | Providence, RI | $1,396 | $2,324 | 66.5% |
| 4 | Houston, TX | $1,469 | $2,433 | 65.6% |
| 5 | San Francisco, CA | $2,435 | $4,000+ | 64.3% |
| 6 | Wichita, KS | $1,010 | $1,636 | 62.0% |
| 7 | Hartford, CT | $1,458 | $2,352 | 61.3% |
| 7 | McAllen, TX | $971 | $1,566 | 61.3% |
| 9 | Milwaukee, WI | $1,177 | $1,849 | 57.1% |
| 10 | Omaha, NE | $1,230 | $1,922 | 56.3% |
| 10 | New Orleans, LA | $1,262 | $1,972 | 56.3% |
| 12 | Worcester, MA | $1,563 | $2,432 | 55.6% |
| 13 | Honolulu, HI | $2,001 | $3,093 | 54.6% |
| 14 | Los Angeles, CA | $2,114 | $3,255 | 54.0% |
| 15 | Chicago, IL | $1,469 | $2,237 | 52.3% |
| 16 | Oklahoma City, OK | $1,162 | $1,767 | 52.1% |
| 16 | Tulsa, OK | $1,115 | $1,696 | 52.1% |
| 18 | Baton Rouge, LA | $1,138 | $1,725 | 51.6% |
| 19 | Minneapolis, MN | $1,444 | $2,182 | 51.1% |
| 19 | Des Moines, IA | $1,178 | $1,780 | 51.1% |
| 21 | Kiryas Joel, NY | $1,688 | $2,534 | 50.1% |
| 22 | Albany, NY | $1,341 | $2,011 | 50.0% |
| 23 | Pittsburgh, PA | $1,083 | $1,619 | 49.5% |
| 24 | St. Louis, MO | $1,154 | $1,720 | 49.0% |
| 25 | Kansas City, MO | $1,315 | $1,945 | 47.9% |
| 26 | Toledo, OH | $949 | $1,401 | 47.6% |
| 27 | Madison, WI | $1,437 | $2,118 | 47.4% |
| 27 | New Haven, CT | $1,600 | $2,358 | 47.4% |
| 29 | Stockton, CA | $1,788 | $2,634 | 47.3% |
| 29 | Syracuse, NY | $1,114 | $1,641 | 47.3% |
| 31 | Austin, TX | $1,784 | $2,610 | 46.3% |
| 32 | Seattle, WA | $2,050 | $2,989 | 45.8% |
| 33 | El Paso, TX | $1,081 | $1,575 | 45.7% |
| 34 | Dallas, TX | $1,718 | $2,491 | 45.0% |
| 35 | Cleveland, OH | $1,087 | $1,570 | 44.4% |
| 36 | Akron, OH | $1,059 | $1,523 | 43.8% |
| 37 | Boston, MA | $2,093 | $3,005 | 43.6% |
| 38 | Rochester, NY | $1,172 | $1,682 | 43.5% |
| 39 | Fresno, CA | $1,513 | $2,166 | 43.2% |
| 40 | Cincinnati, OH | $1,203 | $1,721 | 43.1% |
| 41 | Buffalo, NY | $1,114 | $1,593 | 43.0% |
| 42 | San Antonio, TX | $1,422 | $2,023 | 42.3% |
| 43 | Winston-Salem, NC | $1,102 | $1,566 | 42.1% |
| 43 | Fayetteville, AR | $1,222 | $1,736 | 42.1% |
| 45 | Provo, UT | $1,611 | $2,282 | 41.7% |
| 46 | San Jose, CA | $2,827 | $4,000+ | 41.5% |
| 47 | Portland, OR | $1,767 | $2,492 | 41.0% |
| 48 | Sacramento, CA | $1,904 | $2,674 | 40.4% |
| 49 | Philadelphia, PA | $1,567 | $2,199 | 40.3% |
| 50 | Columbus, OH | $1,359 | $1,905 | 40.2% |
| 51 | Harrisburg, PA | $1,254 | $1,755 | 40.0% |
| 52 | Washington, DC | $2,037 | $2,850 | 39.9% |
| 53 | Baltimore, MD | $1,633 | $2,278 | 39.5% |
| 54 | Louisville, KY | $1,140 | $1,586 | 39.1% |
| 55 | Spokane, WA | $1,405 | $1,953 | 39.0% |
| 56 | San Diego, CA | $2,336 | $3,243 | 38.8% |
| 57 | Jackson, MS | $1,100 | $1,526 | 38.7% |
| 58 | Denver, CO | $1,943 | $2,681 | 38.0% |
| 59 | Detroit, MI | $1,248 | $1,718 | 37.7% |
| 60 | Albuquerque, NM | $1,220 | $1,670 | 36.9% |
| 61 | Oxnard, CA | $2,313 | $3,150 | 36.2% |
| 61 | Little Rock, AR | $1,093 | $1,489 | 36.2% |
| 63 | Bakersfield, CA | $1,479 | $1,996 | 35.0% |
| 64 | Dayton, OH | $1,119 | $1,505 | 34.5% |
| 65 | Augusta, GA | $1,243 | $1,669 | 34.3% |
| 66 | Tucson, AZ | $1,300 | $1,744 | 34.2% |
| 67 | Indianapolis, IN | $1,273 | $1,707 | 34.1% |
| 68 | Allentown, PA | $1,458 | $1,947 | 33.5% |
| 69 | Salt Lake City, UT | $1,659 | $2,213 | 33.4% |
| 70 | Knoxville, TN | $1,219 | $1,611 | 32.2% |
| 71 | Birmingham, AL | $1,262 | $1,666 | 32.0% |
| 72 | Colorado Springs, CO | $1,761 | $2,321 | 31.8% |
| 73 | Virginia Beach, VA | $1,556 | $2,023 | 30.0% |
| 74 | Chattanooga, TN | $1,265 | $1,631 | 28.9% |
| 75 | Lakeland, FL | $1,484 | $1,904 | 28.3% |
| 76 | Raleigh, NC | $1,674 | $2,144 | 28.1% |
| 77 | Miami, FL | $2,083 | $2,664 | 27.9% |
| 78 | Jacksonville, FL | $1,625 | $2,076 | 27.8% |
| 79 | Greensboro, NC | $1,171 | $1,489 | 27.2% |
| 80 | Memphis, TN | $1,330 | $1,691 | 27.1% |
| 81 | Riverside, CA | $2,006 | $2,546 | 26.9% |
| 82 | Greenville, SC | $1,236 | $1,560 | 26.2% |
| 83 | Durham, NC | $1,598 | $2,006 | 25.5% |
| 84 | Grand Rapids, MI | $1,289 | $1,607 | 24.7% |
| 84 | Ogden, UT | $1,641 | $2,046 | 24.7% |
| 86 | Richmond, VA | $1,546 | $1,897 | 22.7% |
| 87 | Columbia, SC | $1,257 | $1,528 | 21.6% |
| 88 | Charleston, SC | $1,714 | $2,072 | 20.9% |
| 89 | Tampa, FL | $1,776 | $2,143 | 20.7% |
| 90 | Nashville, TN | $1,627 | $1,962 | 20.6% |
| 91 | Atlanta, GA | $1,770 | $2,127 | 20.2% |
| 92 | Charlotte, NC | $1,594 | $1,914 | 20.1% |
| 93 | Palm Bay, FL | $1,681 | $2,014 | 19.8% |
| 94 | North Port, FL | $1,920 | $2,261 | 17.8% |
| 95 | Deltona, FL | $1,614 | $1,886 | 16.9% |
| 96 | Boise, ID | $1,628 | $1,900 | 16.7% |
| 97 | Las Vegas, NV | $1,739 | $2,025 | 16.4% |
| 98 | Cape Coral, FL | $1,871 | $2,149 | 14.9% |
| 99 | Orlando, FL | $1,877 | $2,134 | 13.7% |
| 100 | Phoenix, AZ | $1,819 | $2,003 | 10.1% |
To rent or to buy? Expert tips on taking homeownership leap
If you’re struggling with the decision of whether to rent or buy a home, know that there’s no right or wrong answer. To help you choose your best option, carefully consider your budget, lifestyle and financial goals. Schulz also recommends the following:
- Control what you can control. “You can’t time the market, but you have more power over things than you realize,” he says. “Considering different types of mortgages beyond the traditional 30-year fixed mortgages can help you keep costs down. Being flexible when it comes to location and even the characteristics of a home can help, too. Building savings in a high-yield savings account to put toward a down payment is a great idea if you can afford to. Shopping around to find the best possible mortgage rates when applying can save you tens of thousands of dollars. All these things can pay major dividends if you’re able to put in the time, effort and money.”
- Make sure you understand your own priorities. “Not everyone wants to or needs to own a home,” Schulz says. “If you don’t want to, great! That’s your choice. You shouldn’t let anyone pressure you into diving into homeownership if it isn’t your thing. If you’re gung-ho about it, think through what matters most to you about it: location, square footage, acreage, school systems, style, investment potential and other possible factors to consider. Everyone’s answer will be different, but taking the time to ponder what matters to you can make it more likely that you find the home that is perfect for you.”
- Build a realistic timeline and stick to it. Buying a home can take longer than you expect. From saving up a down payment to improving your credit to finding the right house, there are lots of steps involved, and each one deserves time and attention. Mapping out what you can tackle in the next three months, the next six months and the next year can help you stay focused and keep the process from feeling overwhelming. A clear timeline can also help you avoid rushed decisions — and give you a better shot at getting a home you’re truly happy with.
Methodology
LendingTree researchers analyzed the U.S. Census Bureau 2024 and 2023 American Community Surveys with one-year estimates to determine the median costs to rent and own a home with a mortgage in the nation’s 100 largest metros.
The housing cost variables used — median monthly gross rent and median monthly housing costs with a mortgage — include the total monthly cost that renters or owners incur, including utilities, fees and/or taxes.
View mortgage loan offers from up to 5 lenders in minutes