Fair Market Rents Have Risen Dramatically Since 2021


Fair Market Rents for one- and two-bedroom residential units have jumped dramatically since 2021, according to a LendingTree study — a clear sign that renting has become more expensive across much of the U.S.
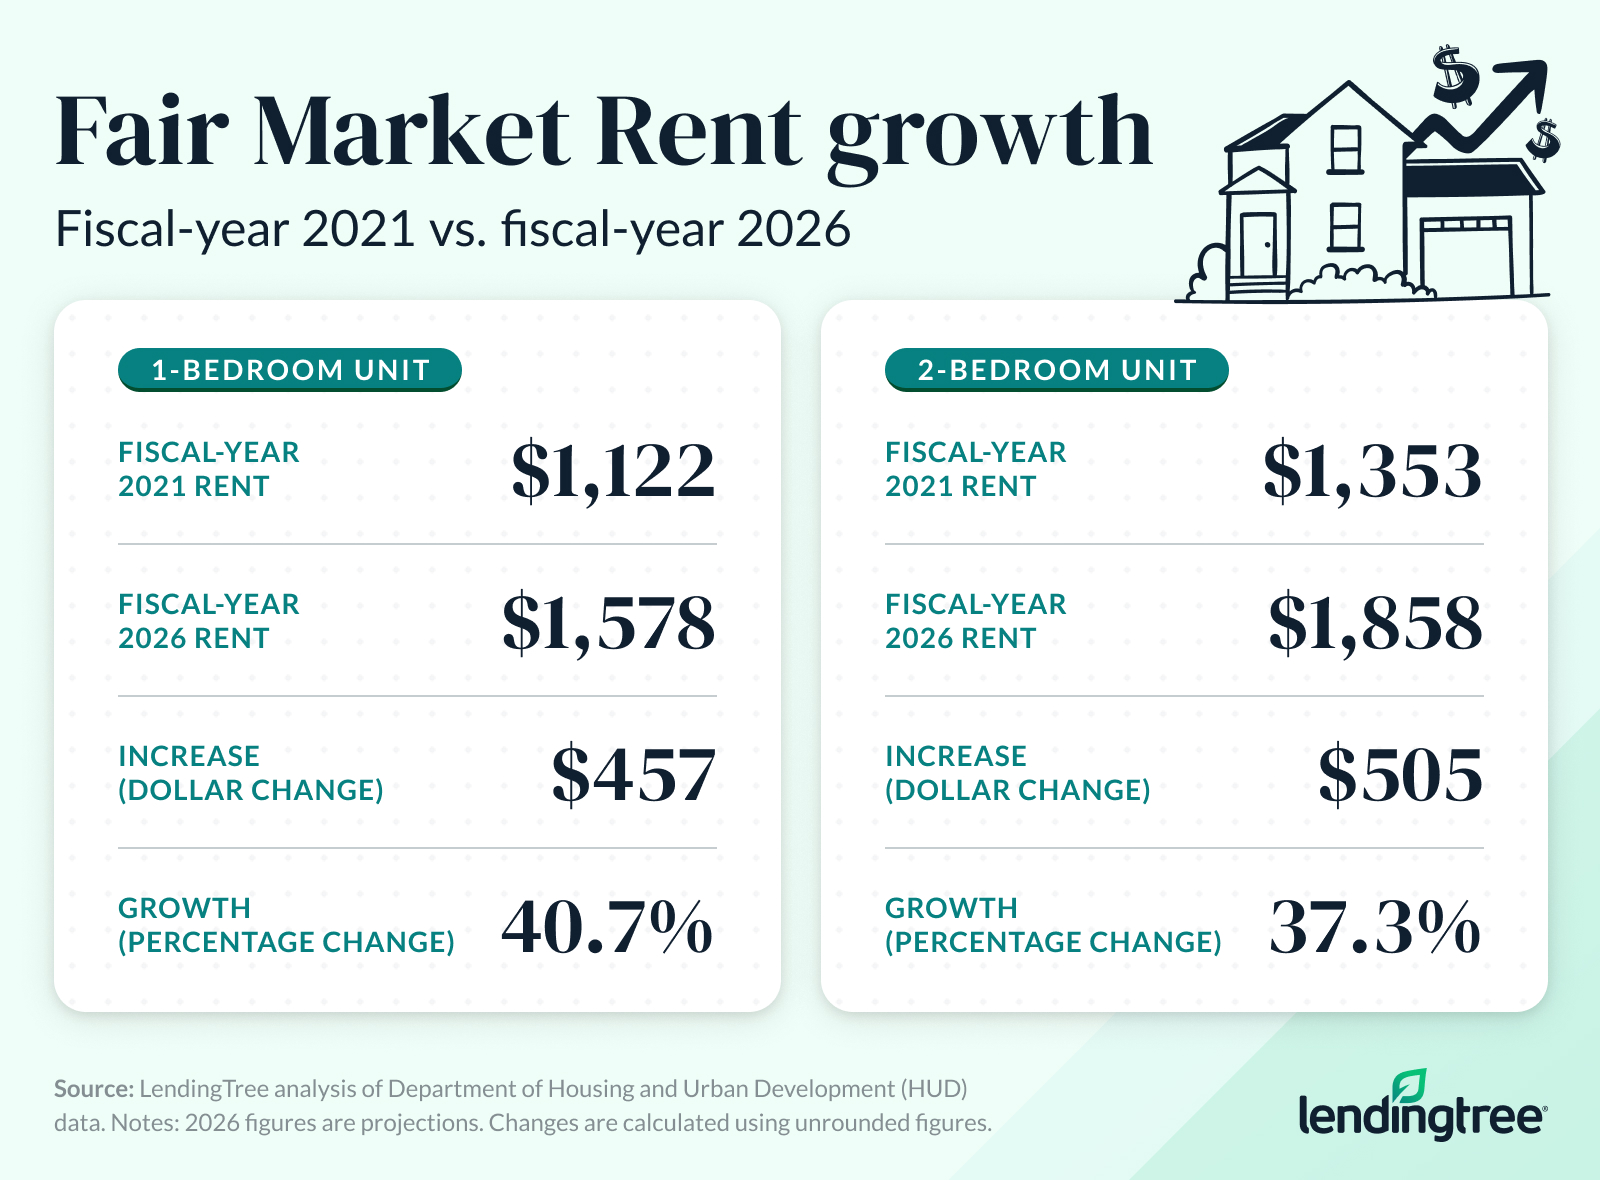
On average, one-bedroom Fair Market Rents in the country’s 50 largest metros are up $457 (or 40.7%) between fiscal-years 2021 and 2026. Two-bedrooms climbed an average of $505 (or 37.3%) during that time frame. These rising costs show how quickly and drastically the rental market has shifted for new and renewing tenants.
Fair Market Rents (FMRs) are estimates from the U.S. Department of Housing and Urban Development (HUD) of what it costs to rent a modest, nonluxury home in a given area. HUD sets FMRs at roughly the 40th percentile of rents in each market, meaning they reflect typical prices — not luxury or top-tier units. These figures help determine payment standards for housing programs like Section 8 and provide a consistent benchmark for tracking rent trends.
HUD bases its estimates primarily on U.S. Census Bureau American Community Survey (ACS) data, and it updates them annually to reflect rent changes and inflation. Because the federal fiscal year runs from Oct. 1 through Sept. 30, this study covers changes from FY 2021 (starting Oct. 1, 2020) through FY 2026 (starting Oct. 1, 2025).
It’s important to note that FMRs are estimates, not exact market rents, and FY 2026 calculations are projections based on the most recent ACS data (2019-23) adjusted for rent growth and inflation.
Key findings
- In each of the 50 largest U.S. metros, Fair Market Rents for one- and two-bedroom housing units grew from fiscal-year 2021 to fiscal-year 2026 (which began Oct. 1, 2025). On average, FMRs for one- and two-bedroom units grew by $457 and $505, respectively.
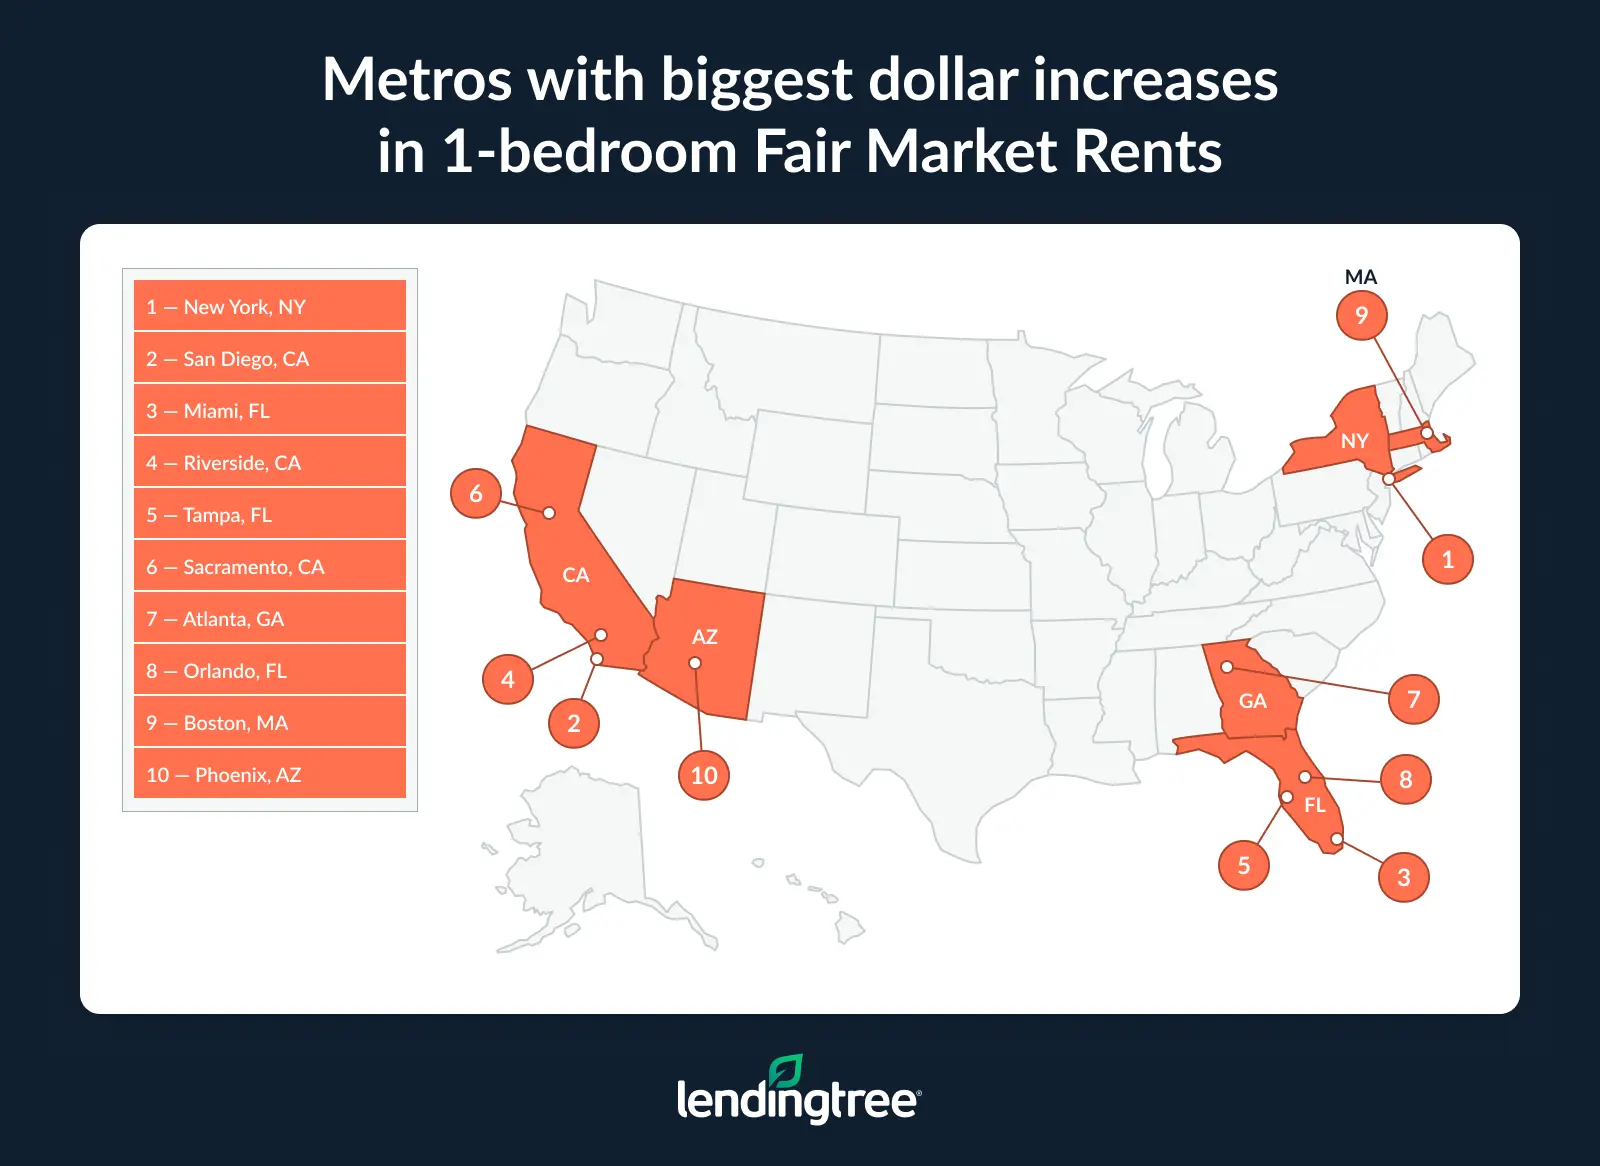
- Fair Market Rents for one-bedroom units increased by the largest dollar amounts in New York, San Diego and Miami. In these metros, FMRs for one-bedroom units rose by $854, $817 and $764, respectively, from FY 2021 to FY 2026.
- Similar to one-bedroom units, Fair Market Rents for two-bedroom units increased the most in Miami, San Diego and New York. From FY 2021 to FY 2026, FMRs in these metros rose by $885, $877 and $857, respectively.
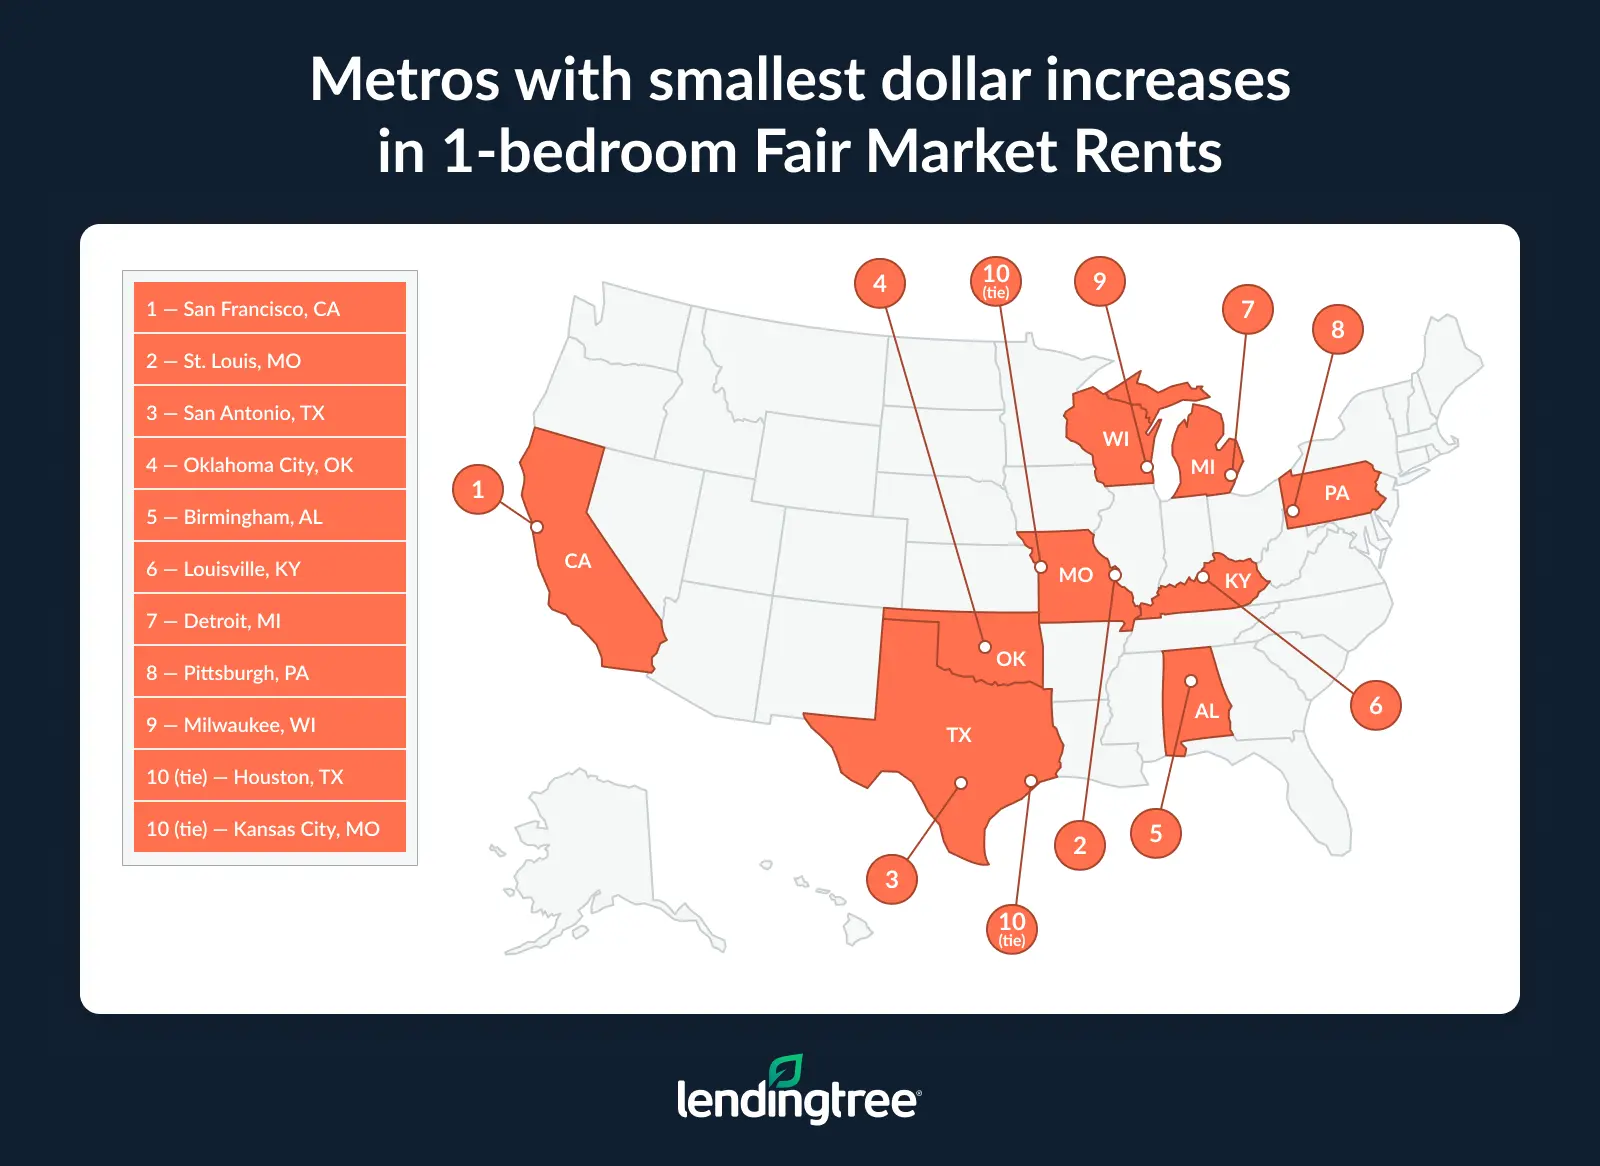
- San Francisco saw the smallest Fair Market Rent increases among major metros. From FY 2021 to FY 2026, its one-bedroom FMR rose by just $54 to $2,977, while two-bedroom FMRs increased by $51 to $3,604. Despite the low growth, these remain among the nation’s most costly rents.
- Outside of San Francisco, four metros ranked in the bottom five for Fair Market Rent increases across one- and two-bedroom units: Birmingham, Ala., Oklahoma City, San Antonio, Texas, and St. Louis, Mo. From FY 2021 to FY 2026, rents in these areas rose between $264 and $326.
Fair Market Rents have grown since 2021
Fair Market Rents rose significantly in the 50 largest metros between fiscal-years 2021 and 2026. Federal fiscal years run from Oct. 1 to Sept. 30 each year; the Department of Housing and Urban Development (HUD) projects FMRs for each fiscal year using the most recent U.S. Census Bureau American Community Survey and adjusting for inflation and rent growth. For FY 2026 (Oct. 1, 2025, to Sept. 30, 2026), HUD used the 2019-23 ACS with five-year estimates to project Fair Market Rents.
On average, FMRs for one-bedroom units in the 50 largest metros grew by 40.7%, or $457, from $1,122 in fiscal-year 2021 to $1,578 in fiscal-year 2026. In the same period, FMRs on two-bedrooms climbed 37.3%, or $505, from $1,353 to $1,858.
The increase in FMRs between FY 2021 and FY 2026 reflects a combination of factors: elevated rent inflation in the years after the pandemic, shifts in migration and demographic trends that increased housing demand, and a longstanding housing supply shortage. According to the Brookings Institution, overall inflation peaked in mid-2022, while housing inflation peaked nearly a year later in 2023 and remains elevated and above nonhousing inflation through 2025.
“These rent increases can cause a massive strain on consumers,” says Matt Schulz, LendingTree chief consumer finance analyst and author of “Ask Questions, Save Money, Make More: How to Take Control of Your Financial Life.” “If your income is rising at the same time your rent is, maybe that extra expense is no big deal. However, so many Americans’ financial wiggle room is tiny, even in the best of times, so having to carve out hundreds of extra dollars to pay rent each month can be a big deal.”
The reality for most renters is that their wages have likely not kept up with these rent increases. Housing costs have outpaced income growth over the past two decades in most regions of the U.S. According to the U.S. Treasury, over 90% of Americans live in counties where median rents and house prices grew faster than median incomes between 2000 and 2020.
The impact is that many consumers have less money available to spend on other essentials, such as food, health care, clothing, education and savings, resulting in “house-poor” homeowners and sidelined homebuyers.
Major metros have seen largest jumps in 1-, 2-bedroom FMRs
While FMRs rose by $457 on average for one-bedroom units across the 50 metros, several experienced much higher dollar increases between fiscal-years 2021 and 2026.
New York saw the largest dollar increase, with average one-bedroom rents rising by $854, from $1,801 to $2,655. San Diego had the next highest increase, jumping by $817 from $1,642 to $2,459. Ranking third, Miami had a $764 increase, from $1,231 to $1,995.
New York’s significant FMR rise reflects intense demand, low vacancy and limited supply. It’s also a reflection of the metro’s unique housing dynamics: New York is largely a city of renters, with 69.0% of households renting their homes, compared with the national average of 34.8%. Additionally, more than half of the city’s rental units are rent-regulated in some form, creating a unique rental market climate. Vacancy rates for rent-stabilized and market-rate units have been very low, and city analyses find that housing production hasn’t kept pace with household growth.
Similarly, San Diego’s increase is driven by strong rent growth amid constrained supply, though the metro has recently seen surges in housing permits, alleviating some inventory challenges. Notably, studies show that ZIP codes with the fewest new-home permits experienced faster rent growth. Despite the surge in permits, the region still falls short of the number of units needed to fully relieve rent pressures.
Miami’s very large FMR jump, meanwhile, likely reflects huge population increases and rising housing demand. Florida — and Miami specifically — saw strong domestic and international migration in recent years, increasing demand for rental housing.
In addition to having the third-highest dollar increase in its one-bedroom FMR, Miami had the third-highest percentage jump (62.1%) across the 50 metros in our study. Other metros with significant percentage increases include Tampa, Fla. (63.1%), Indianapolis (62.2%), Riverside, Calif. (60.7%), and Atlanta (59.6%).
Looking at FMRs for two-bedroom units, Miami, San Diego and New York had the top three dollar increases again, although not in the same order as for one-bedroom units. The FMR on two-bedroom units in Miami saw the largest increase, jumping by $885, from $1,551 to $2,436. In San Diego, the two-bedroom FMR rose by $877, from $2,124 to $3,001. And in New York, it jumped by $857, from $2,053 to $2,910.
Metros with the highest percentage increases in two-bedroom unit FMRs include Riverside (58.3%), Miami (57.1%), Fresno, Calif. (56.4%), Indianapolis (55.7%) and Tampa (55.5%).
Full rankings: Metros with biggest dollar increases in 1-bedroom Fair Market Rents
| Rank | Metro | FMR, FY 2021 | FMR, FY 2026 | $ change | % change |
|---|---|---|---|---|---|
| 1 | New York, NY | $1,801 | $2,655 | $854 | 47.4% |
| 2 | San Diego, CA | $1,642 | $2,459 | $817 | 49.8% |
| 3 | Miami, FL | $1,231 | $1,995 | $764 | 62.1% |
| 4 | Riverside, CA | $1,106 | $1,777 | $671 | 60.7% |
| 5 | Tampa, FL | $1,040 | $1,696 | $656 | 63.1% |
| 6 | Sacramento, CA | $1,188 | $1,832 | $644 | 54.2% |
| 7 | Atlanta, GA | $1,040 | $1,660 | $620 | 59.6% |
| 8 | Orlando, FL | $1,140 | $1,731 | $591 | 51.8% |
| 9 | Boston, MA | $1,924 | $2,476 | $552 | 28.7% |
| 10 | Phoenix, AZ | $1,032 | $1,583 | $551 | 53.4% |
| 11 | Nashville, TN | $1,031 | $1,578 | $547 | 53.1% |
| 11 | Seattle, WA | $1,599 | $2,146 | $547 | 34.2% |
| 13 | Raleigh, NC | $1,053 | $1,596 | $543 | 51.6% |
| 14 | Las Vegas, NV | $937 | $1,478 | $541 | 57.7% |
| 15 | Virginia Beach, VA | $972 | $1,512 | $540 | 55.6% |
| 16 | Charlotte, NC | $1,010 | $1,538 | $528 | 52.3% |
| 17 | Dallas, TX | $1,134 | $1,648 | $514 | 45.3% |
| 18 | Fresno, CA | $851 | $1,355 | $504 | 59.2% |
| 19 | Richmond, VA | $1,020 | $1,507 | $487 | 47.7% |
| 20 | Indianapolis, IN | $781 | $1,267 | $486 | 62.2% |
| 21 | Los Angeles, CA | $1,605 | $2,085 | $480 | 29.9% |
| 21 | Philadelphia, PA | $1,040 | $1,520 | $480 | 46.2% |
| 23 | Washington, DC | $1,552 | $2,015 | $463 | 29.9% |
| 24 | Jacksonville, FL | $921 | $1,382 | $461 | 50.1% |
| 24 | Grand Rapids, MI | $817 | $1,278 | $461 | 56.4% |
| 26 | Chicago, IL | $1,122 | $1,581 | $459 | 40.9% |
| 27 | Salt Lake City, UT | $1,001 | $1,456 | $455 | 45.5% |
| 28 | Denver, CO | $1,304 | $1,754 | $450 | 34.5% |
| 29 | Providence, RI | $955 | $1,402 | $447 | 46.8% |
| 30 | San Jose, CA | $2,558 | $2,982 | $424 | 16.6% |
| 31 | Baltimore, MD | $1,115 | $1,511 | $396 | 35.5% |
| 32 | Memphis, TN | $784 | $1,154 | $370 | 47.2% |
| 33 | Buffalo, NY | $772 | $1,139 | $367 | 47.5% |
| 33 | Columbus, OH | $827 | $1,194 | $367 | 44.4% |
| 35 | Cincinnati, OH | $698 | $1,051 | $353 | 50.6% |
| 35 | Cleveland, OH | $705 | $1,058 | $353 | 50.1% |
| 37 | Minneapolis, MN | $1,054 | $1,405 | $351 | 33.3% |
| 38 | Austin, TX | $1,212 | $1,562 | $350 | 28.9% |
| 39 | Portland, OR | $1,331 | $1,677 | $346 | 26.0% |
| 40 | Kansas City, MO | $857 | $1,197 | $340 | 39.7% |
| 40 | Houston, TX | $983 | $1,323 | $340 | 34.6% |
| 42 | Milwaukee, WI | $803 | $1,119 | $316 | 39.4% |
| 43 | Pittsburgh, PA | $772 | $1,077 | $305 | 39.5% |
| 44 | Detroit, MI | $821 | $1,122 | $301 | 36.7% |
| 45 | Louisville, KY | $760 | $1,047 | $287 | 37.8% |
| 46 | Birmingham, AL | $871 | $1,155 | $284 | 32.6% |
| 47 | Oklahoma City, OK | $738 | $1,017 | $279 | 37.8% |
| 48 | San Antonio, TX | $912 | $1,177 | $265 | 29.1% |
| 49 | St. Louis, MO | $731 | $995 | $264 | 36.1% |
| 50 | San Francisco, CA | $2,923 | $2,977 | $54 | 1.8% |
Full rankings: Metros with biggest dollar increases in 2-bedroom Fair Market Rents
| Rank | Metro | FMR, FY 2021 | FMR, FY 2026 | $ change | % change |
|---|---|---|---|---|---|
| 1 | Miami, FL | $1,551 | $2,436 | $885 | 57.1% |
| 2 | San Diego, CA | $2,124 | $3,001 | $877 | 41.3% |
| 3 | New York, NY | $2,053 | $2,910 | $857 | 41.7% |
| 4 | Riverside, CA | $1,390 | $2,201 | $811 | 58.3% |
| 5 | Sacramento, CA | $1,495 | $2,255 | $760 | 50.8% |
| 6 | Tampa, FL | $1,271 | $1,977 | $706 | 55.5% |
| 7 | Orlando, FL | $1,321 | $1,972 | $651 | 49.3% |
| 8 | Atlanta, GA | $1,185 | $1,820 | $635 | 53.6% |
| 9 | Boston, MA | $2,336 | $2,941 | $605 | 25.9% |
| 10 | Fresno, CA | $1,064 | $1,664 | $600 | 56.4% |
| 11 | Seattle, WA | $1,906 | $2,501 | $595 | 31.2% |
| 12 | Las Vegas, NV | $1,143 | $1,735 | $592 | 51.8% |
| 13 | Phoenix, AZ | $1,251 | $1,839 | $588 | 47.0% |
| 14 | Providence, RI | $1,148 | $1,729 | $581 | 50.6% |
| 15 | Dallas, TX | $1,352 | $1,931 | $579 | 42.8% |
| 16 | Virginia Beach, VA | $1,147 | $1,713 | $566 | 49.3% |
| 17 | Raleigh, NC | $1,200 | $1,750 | $550 | 45.8% |
| 17 | Philadelphia, PA | $1,260 | $1,810 | $550 | 43.7% |
| 19 | Jacksonville, FL | $1,113 | $1,658 | $545 | 49.0% |
| 20 | Los Angeles, CA | $2,058 | $2,601 | $543 | 26.4% |
| 20 | Salt Lake City, UT | $1,204 | $1,747 | $543 | 45.1% |
| 22 | Grand Rapids, MI | $994 | $1,531 | $537 | 54.0% |
| 23 | Charlotte, NC | $1,151 | $1,686 | $535 | 46.5% |
| 24 | Nashville, TN | $1,197 | $1,730 | $533 | 44.5% |
| 25 | Indianapolis, IN | $946 | $1,473 | $527 | 55.7% |
| 26 | Richmond, VA | $1,163 | $1,655 | $492 | 42.3% |
| 27 | Denver, CO | $1,605 | $2,089 | $484 | 30.2% |
| 28 | Chicago, IL | $1,299 | $1,781 | $482 | 37.1% |
| 29 | Washington, DC | $1,773 | $2,253 | $480 | 27.1% |
| 30 | Baltimore, MD | $1,384 | $1,857 | $473 | 34.2% |
| 31 | Cincinnati, OH | $916 | $1,353 | $437 | 47.7% |
| 32 | San Jose, CA | $3,051 | $3,483 | $432 | 14.2% |
| 33 | Buffalo, NY | $920 | $1,343 | $423 | 46.0% |
| 34 | Austin, TX | $1,434 | $1,852 | $418 | 29.1% |
| 35 | Cleveland, OH | $865 | $1,279 | $414 | 47.9% |
| 36 | Minneapolis, MN | $1,308 | $1,709 | $401 | 30.7% |
| 37 | Columbus, OH | $1,031 | $1,430 | $399 | 38.7% |
| 38 | Houston, TX | $1,176 | $1,573 | $397 | 33.8% |
| 39 | Portland, OR | $1,536 | $1,922 | $386 | 25.1% |
| 40 | Milwaukee, WI | $973 | $1,338 | $365 | 37.5% |
| 41 | Memphis, TN | $911 | $1,274 | $363 | 39.8% |
| 42 | Detroit, MI | $1,049 | $1,411 | $362 | 34.5% |
| 43 | Pittsburgh, PA | $940 | $1,299 | $359 | 38.2% |
| 44 | Louisville, KY | $918 | $1,272 | $354 | 38.6% |
| 45 | Kansas City, MO | $1,021 | $1,358 | $337 | 33.0% |
| 46 | Oklahoma City, OK | $918 | $1,244 | $326 | 35.5% |
| 47 | San Antonio, TX | $1,114 | $1,426 | $312 | 28.0% |
| 48 | St. Louis, MO | $938 | $1,218 | $280 | 29.9% |
| 49 | Birmingham, AL | $1,002 | $1,266 | $264 | 26.3% |
| 50 | San Francisco, CA | $3,553 | $3,604 | $51 | 1.4% |
San Francisco saw smallest jumps in Fair Market Rents
Despite notoriously having one of the country’s most expensive housing markets, San Francisco had the lowest increases in Fair Market Rents between fiscal-years 2021 and 2026. The FMR on one-bedroom units rose by just 1.8%, or $54, from $2,923 to $2,977; two-bedroom units similarly jumped by 1.4%, or $51, from $3,553 to $3,604.
San Francisco’s unusually low FMR increase likely reflects a mix of demand and policy factors. The city lost a large share of residents after 2020. And unlike other areas of the Golden State, the trend continued in the years that followed. San Francisco’s population remains 3.6% below January 2020 levels. At the same time, San Francisco’s rental laws limit annual rental increases on many units. For example, the current allowable percentage increase is 1.4% on units built before 1979 and not used as single-family dwellings.
“The fact that San Francisco’s population has declined significantly in recent years is surely playing a role,” Schulz says. “Fewer people means less demand for rentals. Less demand for rentals typically means lower prices, or at least slower price growth. That certainly doesn’t mean that San Francisco is becoming a relatively inexpensive place to rent, but it means that the stratospheric growth in housing costs over recent decades has slowed substantially.”
While FMRs moved modestly in San Francisco between fiscal-years 2021 and 2026, the metro has the second-highest one-bedroom FMR ($2,977), just after San Jose, Calif. ($2,982), and the highest two-bedroom FMR ($3,604) among the country’s 50 largest metros.
Other metros with minimal FMR dollar growth include Birmingham, Ala., Oklahoma City, San Antonio, Texas, and St. Louis, Mo., with increases ranging from $264 to $326.
Metros with smallest dollar increases in Fair Market Rents FY 2021 to FY 2026
| Metro | 1-bedroom unit $ increase | 1-bedroom unit % increase | 2-bedroom unit $ increase | 2-bedroom unit % increase |
|---|---|---|---|---|
| San Francisco, CA | $54 | 1.8% | $51 | 1.4% |
| St. Louis, MO | $264 | 36.1% | $280 | 29.9% |
| San Antonio, TX | $265 | 29.1% | $312 | 28.0% |
| Oklahoma City, OK | $279 | 37.8% | $326 | 35.5% |
| Birmingham, AL | $284 | 32.6% | $264 | 26.3% |
In addition to San Francisco (1.8%), metros with the five lowest percentage increases in one-bedroom FMRs include San Jose (16.6%), Portland, Ore. (26.0%), Boston (28.7%) and Austin, Texas (28.9%). For two-bedroom units, San Francisco (1.4%) and Birmingham (26.3%) are joined by San Jose (14.2%), Portland (25.1%) and Boston (25.9%) in the bottom five.
Top expert tips for renters
Rents may be rising, but that doesn’t mean renters are out of options. These strategies will help you save money, strengthen your rental applications and make smarter decisions, whether you’re signing a new lease or renewing an existing one.
- Negotiate before you renew. Even if rents are up in your area, landlords may prefer keeping a reliable tenant to searching for a new one. “It costs more to find a new tenant than to keep you,” Schulz says. “If you leave, they run the risk of going months without any revenue from your unit, and that’s the last thing they want. Knowing that, don’t be afraid to negotiate when faced with a potential rent increase.” When extending your lease, compare local listings to see if your proposed renewal rate is in line with nearby units, and use that data to negotiate.
- Lock in a longer lease if you can. If you plan to stay put, consider asking for an 18- or 24-month lease to secure your current rate and avoid another increase next year. “Longer leases can equal lower prices, and being able to commit to a longer contract can save you money,” Schulz says. “This isn’t for everyone; if you’re not comfortable locking in for two years instead of one, for example, you shouldn’t do it.” In a rising-rent environment, though, predictability can save you hundreds over time.
- Broaden your search radius. Expanding your apartment hunt a few miles from city centers — or exploring up-and-coming neighborhoods — can yield significantly lower rents. Many renters find that a slightly longer commute or smaller metro still offers access to amenities without the premium price tag.
- Research housing programs. Many cities offer rental assistance, housing vouchers or tax credits for lower- and moderate-income renters. Start with your city’s housing authority website or HUD’s rental assistance directory.
- Strengthen your renter profile. A strong credit score and solid rental history can make you more competitive — and, in some cases, give you leverage for better terms. Paying bills on time, reducing debt and asking previous landlords for references can all help when applying for a new lease.
Beyond these tips, Schulz suggests that renters familiarize themselves with the overall renting climate in their neighborhood. “You don’t have to become an expert on the rental market in your area, but having a sense of the costs of various rentals around you gives you information you can use in negotiating a first rental agreement or a renewal.
“It can also help you know when not to negotiate. For example, if every rental in an area has multiple bidders and turns over in days, haggling too much can cost you. But, in other cases, knowing the state of the rental market can help you better determine what to ask for.”
Methodology
Fair Market Rent (FMR) data in this study comes from the U.S. Department of Housing and Urban Development (HUD) for fiscal-year 2021 and fiscal-year 2026.
HUD defines Fair Market Rents as “estimates of 40th percentile gross rents for standard-quality units within a metropolitan area or nonmetropolitan county.” More specifically, FMRs reflect the monthly contract rent (the rent payment specified by a lease) and utility costs paid by those who moved into their home within the past 15 to 22 months. FMR calculations exclude rents for public housing units and for units built within the past two years.
It’s important to note that FMRs aren’t designed to capture the full scope of rents in a given area. As outlined, they represent a specific subset of housing units. Nonetheless, FMRs provide a consistent and useful benchmark for evaluating rents across regions, and examining how they’ve changed over time can offer insight into broader rental market trends.
View mortgage loan offers from up to 5 lenders in minutes