3 in 5 Mortgage Offers on LendingTree Platform Go to First-Time Buyers


Buying a home has been exceedingly difficult in the past few years.
With high mortgage rates and home prices, many would-be buyers stayed out of the housing market in 2024. But the latest LendingTree data shows that among those active in the market last year, first-time buyers received a larger share of offers than those who already own.
In fact, 3 in 5 — 60.9% — offers to users on our platform in 2024 went to first-time buyers. That figure was notably higher in two of the largest states, New York and California.
Here’s what else we found.
Key findings
- 60.9% of mortgage offers to users on the LendingTree platform in 2024 went to those who identified as first-time homebuyers. While this figure is striking, it’s down from 65.3% in 2023.
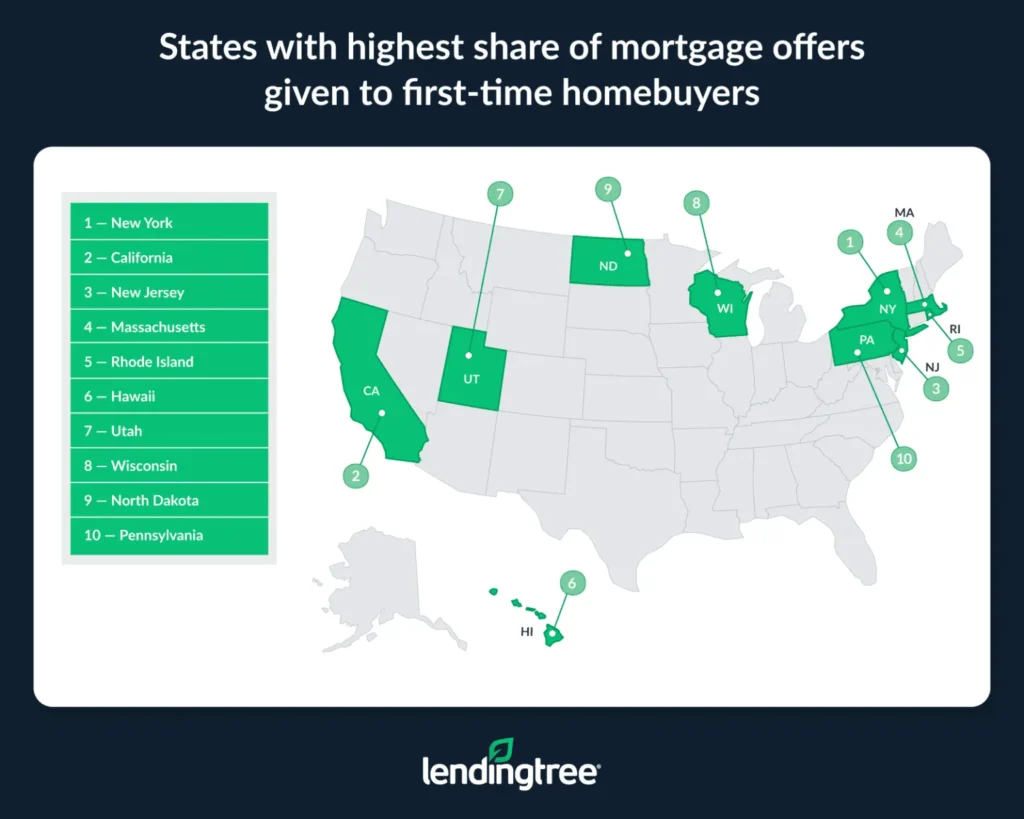
- New York, California and New Jersey saw the highest share of mortgage offers go to first-time buyers. In New York, 3 in 4 — 76.1% — offers went to first-time buyers, down from 77.3% in 2023 but still the highest share in the U.S. California (70.0%) and New Jersey (69.2%) followed, also keeping their same rankings as in 2023.
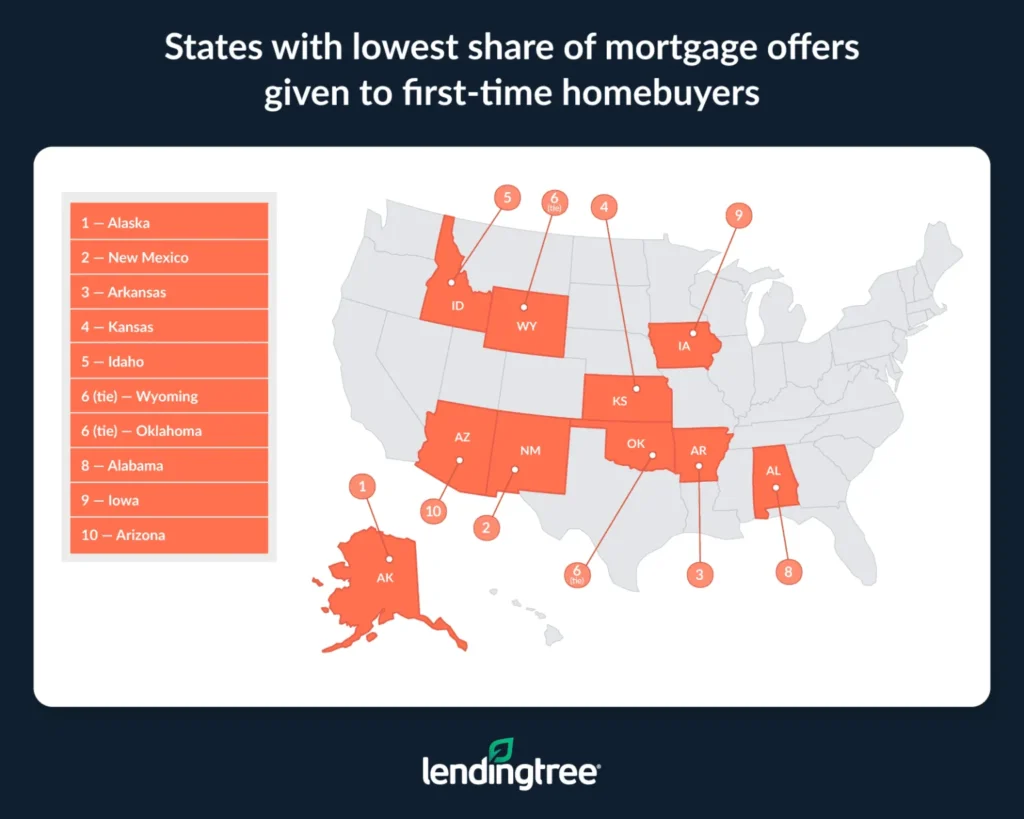
- A new state — Alaska — saw the lowest share of mortgage offers go to first-time buyers. At 47.1%, Alaska was the only state below 50.0% — a significant drop from 54.4% in 2023. It’s joined in the bottom three by New Mexico (51.2%) and Arkansas (52.4%).
- First-time buyers tend to have lower credit scores, down payments and mortgage amounts than repeat buyers. Credit scores for first-time buyers are an average of 32 points lower than those of repeat buyers — 700 versus 732. Down payments are an average of $63,449 lower — $47,654 versus $111,103 — and loan amounts are an average of $56,131 smaller — $321,818 versus $377,949.
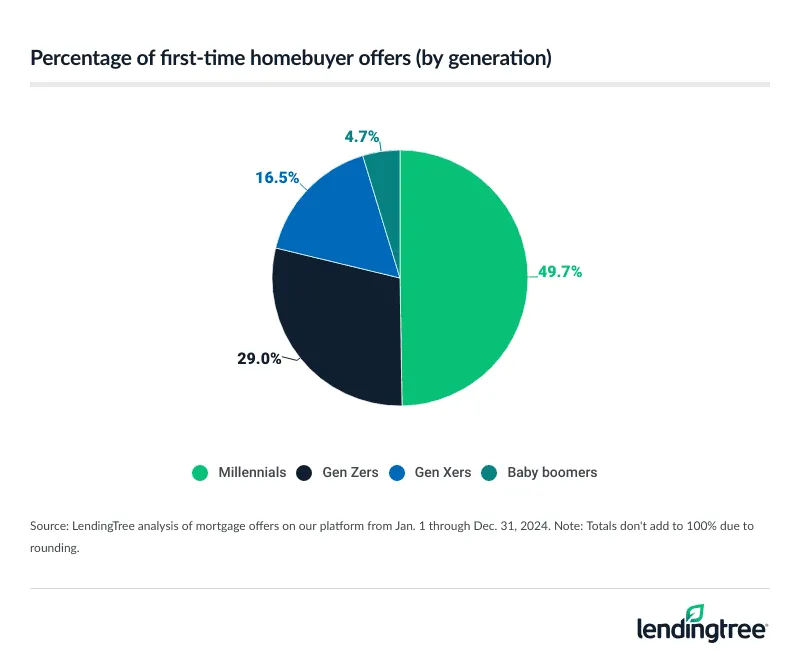
- Millennials received nearly half of the first-time buyer offers. 49.7% of mortgage offers that went to first-time buyers in 2024 went to millennials ages 28 to 43, ahead of Gen Zers ages 18 to 27 at 29.0%. The average age of first-time homebuyers is 36 — right in the middle of the millennial range.
States with highest share of mortgage offers given to first-time homebuyers
No. 1: New York
- Share of mortgage offers given to first-time homebuyers: 76.1%
- Average credit score of first-time homebuyers: 709
- Average down payment from first-time homebuyers: $81,188
- Average loan amount offered to first-time homebuyers: $375,534
No. 2: California
- Share of mortgage offers given to first-time homebuyers: 70.0%
- Average credit score of first-time homebuyers: 713
- Average down payment from first-time homebuyers: $94,967
- Average loan amount offered to first-time homebuyers: $518,883
No. 3: New Jersey
- Share of mortgage offers given to first-time homebuyers: 69.2%
- Average credit score of first-time homebuyers: 712
- Average down payment from first-time homebuyers: $69,553
- Average loan amount offered to first-time homebuyers: $400,037
States with lowest share of mortgage offers given to first-time homebuyers
No. 1: Alaska
- Share of mortgage offers given to first-time homebuyers: 47.1%
- Average credit score of first-time homebuyers: 705
- Average down payment from first-time homebuyers: $27,529
- Average loan amount offered to first-time homebuyers: $316,063
No. 2: New Mexico
- Share of mortgage offers given to first-time homebuyers: 51.2%
- Average credit score of first-time homebuyers: 693
- Average down payment from first-time homebuyers: $33,642
- Average loan amount offered to first-time homebuyers: $268,861
No. 3: Arkansas
- Share of mortgage offers given to first-time homebuyers: 52.4%
- Average credit score of first-time homebuyers: 693
- Average down payment from first-time homebuyers: $26,191
- Average loan amount offered to first-time homebuyers: $229,102
States with highest/lowest share of mortgage offers given to first-time buyers
| Rank | State | % of offers, first-timers | % of offers, repeats | Avg. credit score, first-timers | Avg. credit score, repeats | Avg. down payment, first-timers | Avg. down payment, repeats | Avg. loan amount, first-timers | Avg. loan amount, repeats |
|---|---|---|---|---|---|---|---|---|---|
| 1 | New York | 76.1% | 23.9% | 709 | 735 | $81,188 | $142,464 | $375,534 | $402,836 |
| 2 | California | 70.0% | 30.0% | 713 | 742 | $94,967 | $208,839 | $518,883 | $558,859 |
| 3 | New Jersey | 69.2% | 30.8% | 712 | 739 | $69,553 | $160,665 | $400,037 | $455,101 |
| 4 | Massachusetts | 66.4% | 33.6% | 713 | 742 | $77,383 | $195,966 | $430,147 | $501,409 |
| 5 | Rhode Island | 66.1% | 33.9% | 708 | 739 | $47,664 | $124,122 | $341,768 | $413,319 |
| 6 | Hawaii | 65.7% | 34.3% | 708 | 744 | $67,697 | $152,662 | $499,379 | $550,567 |
| 7 | Utah | 65.4% | 34.6% | 704 | 738 | $33,264 | $101,202 | $367,790 | $440,397 |
| 8 | Wisconsin | 64.2% | 35.8% | 688 | 726 | $30,859 | $82,347 | $241,242 | $308,828 |
| 9 | North Dakota | 63.5% | 36.5% | 687 | 722 | $27,052 | $70,080 | $246,897 | $308,774 |
| 10 | Pennsylvania | 63.2% | 36.8% | 703 | 736 | $38,062 | $103,070 | $264,840 | $341,267 |
| 11 | Oregon | 63.1% | 36.9% | 703 | 737 | $46,962 | $122,595 | $344,792 | $401,685 |
| 12 | Maine | 62.9% | 37.1% | 702 | 733 | $40,845 | $100,668 | $289,961 | $338,169 |
| 13 | Washington | 62.2% | 37.8% | 710 | 740 | $73,870 | $169,576 | $449,687 | $506,340 |
| 14 | New Hampshire | 61.2% | 38.8% | 706 | 737 | $50,068 | $136,261 | $324,675 | $392,849 |
| 15 | Georgia | 60.7% | 39.3% | 693 | 729 | $38,979 | $105,203 | $289,994 | $365,637 |
| 16 | Nevada | 60.6% | 39.4% | 700 | 733 | $48,313 | $109,988 | $356,464 | $404,509 |
| 17 | Ohio | 60.3% | 39.7% | 693 | 729 | $28,728 | $77,469 | $221,310 | $300,845 |
| 18 | Connecticut | 60.1% | 39.9% | 708 | 737 | $59,309 | $136,612 | $335,431 | $388,346 |
| 19 | Texas | 59.9% | 40.1% | 695 | 728 | $36,193 | $93,048 | $295,206 | $379,472 |
| 20 | Florida | 59.8% | 40.2% | 697 | 732 | $40,893 | $112,322 | $311,845 | $366,613 |
| 20 | Vermont | 59.8% | 40.2% | 702 | 731 | $42,217 | $98,393 | $279,273 | $328,813 |
| 22 | Minnesota | 59.5% | 40.5% | 695 | 733 | $35,460 | $103,343 | $265,204 | $352,711 |
| 23 | Virginia | 59.2% | 40.8% | 696 | 735 | $43,901 | $106,433 | $332,358 | $421,761 |
| 24 | Illinois | 59.0% | 41.0% | 708 | 738 | $40,744 | $102,447 | $285,069 | $354,652 |
| 25 | Michigan | 58.9% | 41.1% | 694 | 728 | $28,323 | $75,872 | $223,461 | $297,183 |
| 26 | Maryland | 58.3% | 41.7% | 701 | 734 | $44,465 | $120,320 | $335,232 | $425,312 |
| 27 | Mississippi | 58.1% | 41.9% | 690 | 722 | $21,813 | $55,939 | $209,929 | $286,621 |
| 28 | North Carolina | 57.0% | 43.0% | 702 | 733 | $37,412 | $103,662 | $291,507 | $364,993 |
| 28 | Nebraska | 57.0% | 43.0% | 686 | 729 | $26,656 | $80,598 | $230,483 | $299,713 |
| 30 | Louisiana | 56.9% | 43.1% | 696 | 730 | $26,095 | $71,559 | $226,247 | $309,523 |
| 31 | Missouri | 56.7% | 43.3% | 682 | 725 | $28,070 | $75,891 | $226,145 | $299,667 |
| 31 | Delaware | 56.7% | 43.3% | 701 | 739 | $37,915 | $105,924 | $289,233 | $338,824 |
| 33 | Montana | 56.3% | 43.7% | 704 | 733 | $41,597 | $113,507 | $316,400 | $377,043 |
| 33 | Tennessee | 56.3% | 43.7% | 692 | 728 | $32,530 | $99,540 | $270,192 | $350,384 |
| 35 | South Carolina | 56.1% | 43.9% | 682 | 723 | $32,423 | $93,251 | $254,572 | $323,396 |
| 35 | Kentucky | 56.1% | 43.9% | 694 | 725 | $26,174 | $72,500 | $216,536 | $282,913 |
| 35 | Indiana | 56.1% | 43.9% | 695 | 730 | $24,662 | $72,100 | $219,519 | $293,596 |
| 38 | West Virginia | 56.0% | 44.0% | 691 | 727 | $21,383 | $61,975 | $193,462 | $269,979 |
| 38 | Colorado | 56.0% | 44.0% | 704 | 739 | $48,969 | $139,287 | $386,841 | $471,100 |
| 40 | South Dakota | 55.5% | 44.5% | 680 | 718 | $26,152 | $64,684 | $246,999 | $302,512 |
| 41 | Arizona | 55.4% | 44.6% | 698 | 735 | $42,257 | $122,470 | $335,233 | $400,571 |
| 42 | Iowa | 54.7% | 45.3% | 683 | 725 | $25,828 | $70,113 | $208,832 | $281,655 |
| 43 | Alabama | 54.2% | 45.8% | 685 | 724 | $24,629 | $68,105 | $225,177 | $300,751 |
| 44 | Oklahoma | 53.4% | 46.6% | 690 | 728 | $26,683 | $68,310 | $215,738 | $287,937 |
| 44 | Wyoming | 53.4% | 46.6% | 688 | 731 | $36,195 | $74,647 | $282,595 | $306,834 |
| 46 | Idaho | 53.3% | 46.7% | 699 | 730 | $35,348 | $114,795 | $316,264 | $372,422 |
| 47 | Kansas | 52.7% | 47.3% | 696 | 730 | $27,407 | $78,552 | $228,420 | $306,191 |
| 48 | Arkansas | 52.4% | 47.6% | 693 | 727 | $26,191 | $69,554 | $229,102 | $294,425 |
| 49 | New Mexico | 51.2% | 48.8% | 693 | 730 | $33,642 | $86,320 | $268,861 | $337,959 |
| 50 | Alaska | 47.1% | 52.9% | 705 | 737 | $27,529 | $56,405 | $316,063 | $376,811 |
Why large shares of offers go to first-time homebuyers
In the face of mortgage rates that surpassed 7.00%, 2024’s housing market was again sluggish. Mortgage demand was near its lowest point in more than 20 years.
This helps explain why first-time buyers received such a large share of mortgage offers on the LendingTree platform last year. Unlike repeat buyers, first-timers aren’t generally at risk of feeling “trapped” in their current homes due to low locked-in mortgage rates. First-timers may be more likely than repeat buyers to venture into a high-rate housing market since they don’t have to worry about sacrificing older, more attractive rates on their current mortgages.
Even though newcomers made up a large share of buyers, 2024’s market wasn’t necessarily flooded by massive numbers of them. First-time buyers were likely more comfortable seeking new mortgages, making them a bigger part of a smaller pool of buyers.
Tips for first-time homebuyers
Though some first-timers are buying homes, that doesn’t mean doing so is easy. Here are three tips to help homebuying beginners:
- Give yourself time to prepare. Buying a home can be a challenge, especially if you’re trying to rush the process. The more time you give yourself to do things like save for a down payment, strengthen your credit score and house hunt, the less stressful homebuying is likely to be. And the more time you have to prepare to buy a house, the less likely you are to make knee-jerk decisions you regret.
- Take advantage of first-time buyers programs. Various programs exist to help first-time buyers purchase a home. While not available to everyone, these programs can help some would-be buyers get more favorable loan terms and reduce upfront costs like those associated with a down payment.
- Shop around for a mortgage. Different lenders can offer different rates to the same borrowers. By shopping around and comparing mortgage offers before buying, you could find a lower-rate (and more affordable) option than you would’ve gotten had you gone with the first lender.
Methodology
LendingTree researchers analyzed mortgage offers given to borrowers across the nation’s 50 states (excluding D.C. and the U.S. territories) from Jan. 1 through Dec. 31, 2024, who identified as first-time or repeat homebuyers.
Analysts also calculated the percentage of offers given to each generation compared to all offers made to first-time homebuyers.
We defined generations as the following ages in 2024:
- Generation Z: 18 to 27
- Millennial: 28 to 43
- Generation X: 44 to 59
- Baby boomer: 60 to 78
View mortgage loan offers from up to 5 lenders in minutes