19.1 Million Americans Live in Overcrowded Homes — Where People Are Most Cramped


Nearly 6.0% of Americans — or 19.1 million in total — live in overcrowded homes, according to the newest LendingTree analysis.
Overcrowding can happen for various reasons, whether it’s single parents with more kids than bedrooms or friends who bunk together because they can’t afford their rent or mortgage.
We looked at overcrowding in different ways. Here’s what we found.
Key findings
- 19.1 million Americans, or 5.9% of people in homes, live in overcrowded homes. The states with the highest rate of people in homes with more than two per bedroom are California (12.9%), Hawaii (11.5%) and New York (9.7%). This is less frequent in rural states Vermont (2.4%), West Virginia (2.5%), New Hampshire and Maine (both 2.7%).
- 38.1% of Americans who live in homes have more bedrooms than people. People are most likely to live in homes with more bedrooms than people in Wyoming (47.2%), Delaware (46.9%) and North Dakota (46.4%) and least likely in the District of Columbia (29.3%), Hawaii (29.8%) and California (31.3%).
- There are 93.8 million more bedrooms in the U.S. than people who don’t live in various group quarters. This is most common in the most populous states: Florida has 8.8 million more bedrooms, Texas has 6.6 million more and California has 5.2 million more. New York has 2.2 million fewer bedrooms — the only state below zero.
- Cut another way, there are 289 extra bedrooms for every 1,000 U.S. residents not in group quarters. The states with the largest excess of bedrooms per 1,000 people — assuming one bedroom per person — are Maine (674), Vermont (630) and North Dakota (496).
California has highest rate of residents living in overcrowded homes
Just over 19 million Americans live in homes with more than two people per bedroom, or 5.9% of people in homes.
California has the highest rate of people who live in overcrowded homes, at 12.9%. Hawaii (11.5%) and New York (9.7%) follow.
These states are among those with the most expensive housing costs. For example, this could prevent many families from being able to afford to give each kid their own bedroom, according to Matt Schulz, LendingTree chief consumer finance analyst and author of “Ask Questions, Save Money, Make More: How to Take Control of Your Financial Life.”
“That’s a real sacrifice, but it’s one that many Americans are willing to make to realize their dream of owning a home,” he says.
Multigenerational housing — when three or more generations live under one roof — may also play a role here. While this could make life more affordable, multigenerational housing presents overcrowding risks. This type of living is prevalent in California and Hawaii.
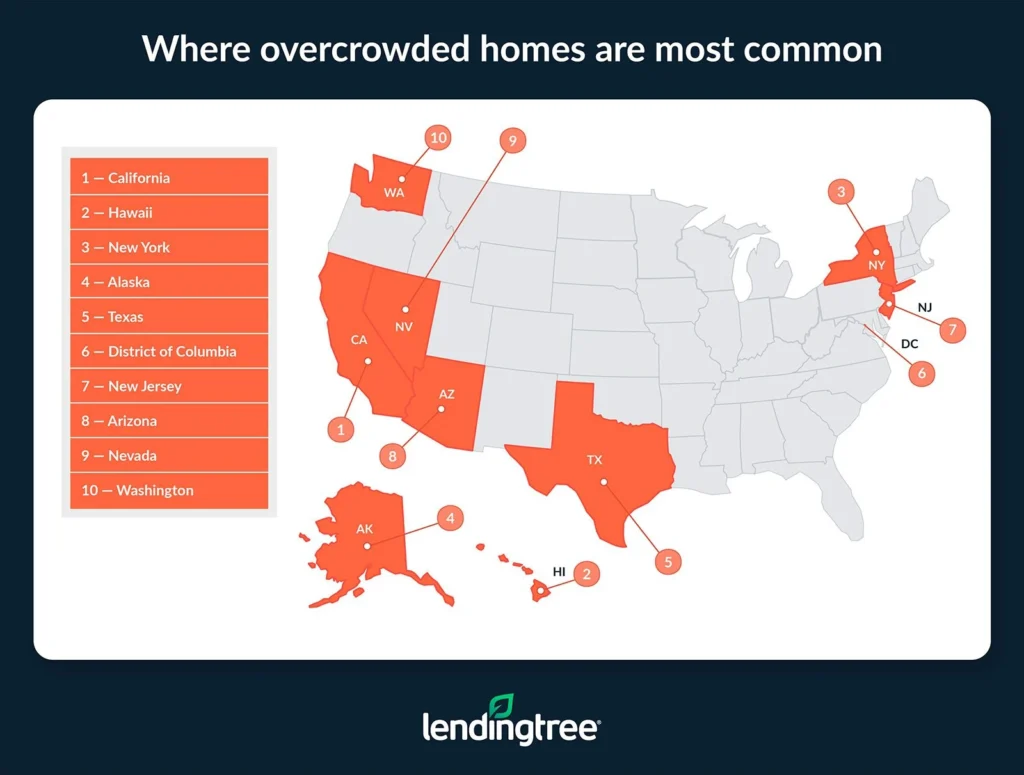
Meanwhile, overcrowding is least frequent in Vermont, at just 2.4% of people in homes. West Virginia (2.5%) follows, with New Hampshire and Maine (both 2.7%) tying for third.
Full rankings: States with highest/lowest % of people in homes with more than 2 people per bedroom
| Rank | State | # in overcrowded homes | % in overcrowded homes |
|---|---|---|---|
| 1 | California | 4,952,475 | 12.9% |
| 2 | Hawaii | 161,192 | 11.5% |
| 3 | New York | 1,871,816 | 9.7% |
| 4 | Alaska | 61,986 | 8.8% |
| 5 | Texas | 2,134,493 | 7.4% |
| 6 | District of Columbia | 42,902 | 6.7% |
| 7 | New Jersey | 595,756 | 6.6% |
| 8 | Arizona | 446,803 | 6.3% |
| 9 | Nevada | 185,885 | 6.0% |
| 10 | Washington | 427,364 | 5.6% |
| 11 | Oregon | 211,117 | 5.1% |
| 12 | Florida | 1,063,299 | 5.0% |
| 12 | Illinois | 626,765 | 5.0% |
| 12 | Maryland | 304,751 | 5.0% |
| 12 | New Mexico | 104,045 | 5.0% |
| 16 | South Dakota | 41,335 | 4.8% |
| 17 | Arkansas | 133,690 | 4.5% |
| 18 | Idaho | 78,580 | 4.3% |
| 18 | Oklahoma | 168,099 | 4.3% |
| 20 | Tennessee | 285,437 | 4.2% |
| 20 | Utah | 137,917 | 4.2% |
| 22 | Georgia | 430,607 | 4.1% |
| 22 | Nebraska | 79,386 | 4.1% |
| 22 | Rhode Island | 43,151 | 4.1% |
| 25 | Louisiana | 180,227 | 4.0% |
| 26 | Indiana | 256,346 | 3.9% |
| 26 | Kentucky | 169,367 | 3.9% |
| 26 | Minnesota | 219,912 | 3.9% |
| 29 | Kansas | 107,383 | 3.8% |
| 30 | Connecticut | 128,010 | 3.7% |
| 30 | Delaware | 35,967 | 3.7% |
| 30 | Massachusetts | 250,998 | 3.7% |
| 30 | Mississippi | 106,754 | 3.7% |
| 30 | Missouri | 222,218 | 3.7% |
| 30 | Montana | 39,796 | 3.7% |
| 36 | North Carolina | 371,834 | 3.6% |
| 36 | Virginia | 303,554 | 3.6% |
| 38 | Colorado | 198,145 | 3.5% |
| 38 | Michigan | 339,891 | 3.5% |
| 40 | Ohio | 381,530 | 3.3% |
| 40 | Pennsylvania | 419,587 | 3.3% |
| 40 | Wyoming | 18,627 | 3.3% |
| 43 | Iowa | 95,464 | 3.1% |
| 43 | South Carolina | 156,861 | 3.1% |
| 45 | North Dakota | 22,736 | 3.0% |
| 45 | Wisconsin | 172,038 | 3.0% |
| 47 | Alabama | 143,276 | 2.9% |
| 48 | Maine | 36,734 | 2.7% |
| 48 | New Hampshire | 36,193 | 2.7% |
| 50 | West Virginia | 43,462 | 2.5% |
| 51 | Vermont | 14,714 | 2.4% |
38.1% of Americans who live in homes have more bedrooms than people
Looking at this more simply by extra bedrooms rather than overcrowded ones, 38.1% of Americans who live in homes have more bedrooms than people. Having just one extra bedroom (20.8%) is most common, but a significant 8.2% have at least three more bedrooms than residents. (Note: This doesn’t account for couples who may share a room.)
By state, those who live in Wyoming are the most likely to have extra space, with 47.2% of people living in homes with more bedrooms than residents. Delaware (46.9%) and North Dakota (46.4%) follow. Schulz says lower housing costs may play a role.
“In states like Wyoming, Delaware and North Dakota, a family may be able to afford a home where they can turn extra bedrooms into office space, media centers or workout rooms,” he says. “That’s generally not something you can do in larger metropolitan areas unless you’re wealthy.”
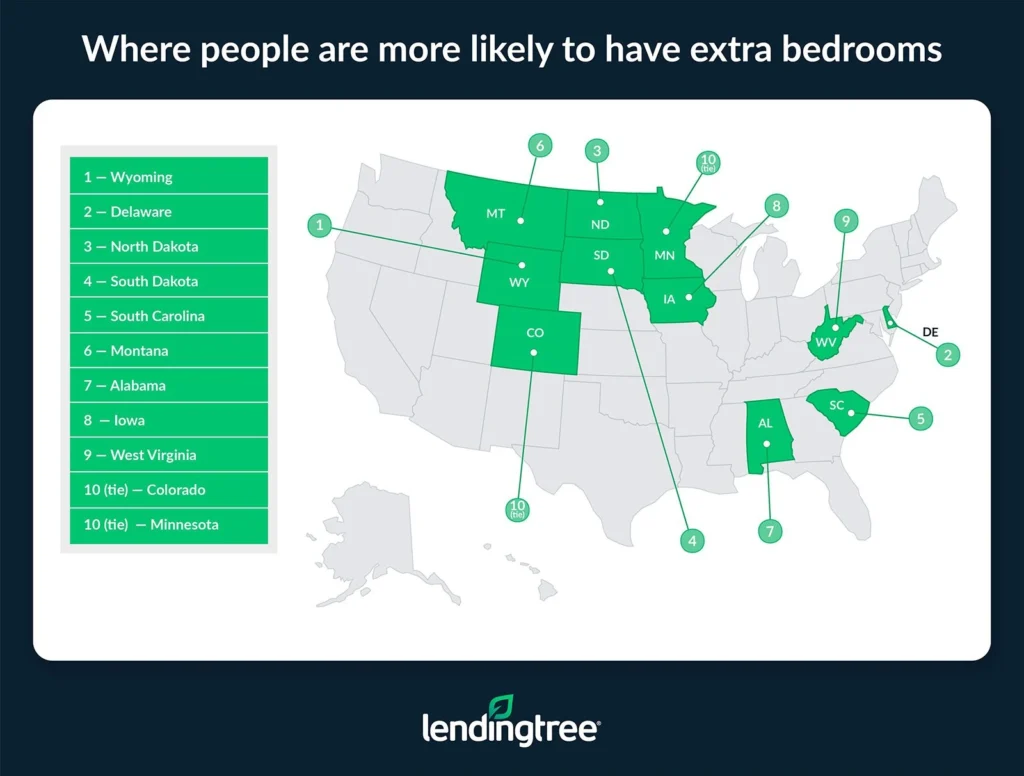
States with higher housing costs are least likely to have extra space. The District of Columbia ranks at the bottom, with only 29.3% of residents in homes with more bedrooms than people. Hawaii (29.8%) and California (31.3%) follow.
Full rankings: States with highest/lowest % of people in homes with extra bedrooms
| Rank | State | 1 extra | 2 extra | 3 extra | 3+ extra | Total extra |
|---|---|---|---|---|---|---|
| 1 | Wyoming | 25.2% | 12.2% | 8.6% | 1.2% | 47.2% |
| 2 | Delaware | 24.1% | 12.7% | 9.4% | 0.7% | 46.9% |
| 3 | North Dakota | 24.0% | 12.4% | 9.2% | 0.8% | 46.4% |
| 4 | South Dakota | 23.6% | 12.0% | 9.7% | 0.9% | 46.2% |
| 5 | South Carolina | 25.8% | 11.7% | 7.6% | 0.6% | 45.7% |
| 6 | Montana | 24.0% | 12.0% | 8.3% | 1.3% | 45.6% |
| 7 | Alabama | 24.4% | 11.9% | 7.7% | 0.6% | 44.6% |
| 8 | Iowa | 24.2% | 10.8% | 8.0% | 0.7% | 43.7% |
| 9 | West Virginia | 25.6% | 10.7% | 6.7% | 0.6% | 43.6% |
| 10 | Colorado | 22.8% | 11.2% | 8.4% | 1.1% | 43.5% |
| 10 | Minnesota | 22.7% | 11.1% | 8.9% | 0.8% | 43.5% |
| 12 | Kansas | 22.8% | 11.3% | 8.5% | 0.8% | 43.4% |
| 13 | Virginia | 23.0% | 11.4% | 8.1% | 0.8% | 43.3% |
| 14 | North Carolina | 24.7% | 10.7% | 6.9% | 0.6% | 42.9% |
| 15 | Georgia | 22.8% | 11.3% | 7.6% | 0.9% | 42.6% |
| 16 | Ohio | 23.8% | 10.5% | 7.5% | 0.6% | 42.4% |
| 16 | Wisconsin | 24.8% | 9.8% | 7.2% | 0.6% | 42.4% |
| 18 | Maryland | 21.3% | 11.0% | 8.5% | 1.2% | 42.0% |
| 18 | Vermont | 24.1% | 9.7% | 7.2% | 1.0% | 42.0% |
| 20 | Pennsylvania | 23.4% | 10.5% | 7.1% | 0.8% | 41.8% |
| 21 | Missouri | 23.6% | 10.1% | 7.3% | 0.6% | 41.6% |
| 22 | Nebraska | 21.8% | 10.5% | 8.1% | 1.0% | 41.4% |
| 23 | Michigan | 23.7% | 10.2% | 6.8% | 0.6% | 41.3% |
| 23 | Tennessee | 23.6% | 10.2% | 6.8% | 0.7% | 41.3% |
| 25 | Idaho | 22.4% | 10.1% | 7.6% | 1.0% | 41.1% |
| 25 | Mississippi | 23.9% | 10.4% | 6.3% | 0.5% | 41.1% |
| 27 | Maine | 23.7% | 9.6% | 6.7% | 0.9% | 40.9% |
| 28 | Kentucky | 23.5% | 9.9% | 6.4% | 0.7% | 40.5% |
| 29 | Indiana | 23.2% | 9.7% | 6.6% | 0.6% | 40.1% |
| 30 | Louisiana | 22.9% | 10.0% | 6.6% | 0.5% | 40.0% |
| 31 | New Mexico | 22.5% | 9.6% | 6.6% | 0.7% | 39.4% |
| 32 | Arkansas | 23.6% | 9.2% | 5.9% | 0.5% | 39.2% |
| 33 | Oregon | 22.4% | 8.6% | 6.6% | 0.7% | 38.3% |
| 34 | Arizona | 20.8% | 9.0% | 7.5% | 0.9% | 38.2% |
| 34 | Oklahoma | 22.5% | 9.2% | 6.0% | 0.5% | 38.2% |
| 34 | Washington | 21.1% | 8.8% | 7.4% | 0.9% | 38.2% |
| 37 | Utah | 18.4% | 10.4% | 7.2% | 1.7% | 37.7% |
| 38 | Florida | 22.2% | 8.2% | 6.4% | 0.8% | 37.6% |
| 39 | Nevada | 20.1% | 9.0% | 7.5% | 0.9% | 37.5% |
| 40 | New Hampshire | 22.2% | 7.9% | 6.5% | 0.7% | 37.3% |
| 41 | Connecticut | 20.4% | 8.8% | 7.1% | 0.9% | 37.2% |
| 42 | Illinois | 20.7% | 8.6% | 6.9% | 0.9% | 37.1% |
| 43 | Texas | 18.7% | 8.1% | 7.1% | 1.1% | 35.0% |
| 44 | Massachusetts | 19.2% | 7.7% | 6.2% | 1.0% | 34.1% |
| 45 | Alaska | 18.9% | 7.6% | 6.3% | 1.2% | 34.0% |
| 45 | New Jersey | 17.6% | 7.7% | 7.2% | 1.5% | 34.0% |
| 47 | Rhode Island | 19.9% | 6.9% | 5.6% | 0.9% | 33.3% |
| 48 | New York | 16.1% | 6.5% | 6.6% | 2.2% | 31.4% |
| 49 | California | 14.9% | 6.6% | 8.1% | 1.7% | 31.3% |
| 50 | Hawaii | 16.2% | 6.2% | 5.9% | 1.5% | 29.8% |
| 51 | District of Columbia | 15.8% | 6.1% | 5.4% | 2.0% | 29.3% |
States where count of extra bedrooms is highest
Including vacant units, there are 93.8 million more bedrooms in the U.S. than people who don’t live in various group quarters — correctional facilities, student dormitories or nursing facilities. (Note: This is different from our prior sections that looked at those who live in housing units.)
This is most common in the nation’s most populous states, though not in the exact order. Florida has 8.8 million more bedrooms than residents not living in group quarters, likely because of vacation homes. Texas (6.6 million) and California (5.2 million) are next.
Schulz believes that boils down to geography. “While downtown areas in places like Austin, Miami and San Jose may be cramped and prohibitively priced, there are plenty of other parts of these states where that’s not the case,” he says. “These other areas are less populated, less expensive and offer the possibility of buying a home with plenty of land and more bedrooms than you could ever need. These locations may not be as sexy as South Beach and Beverly Hills, but they’re worth considering if one of your biggest priorities is finding a big home with more than enough space for your family and visitors.”
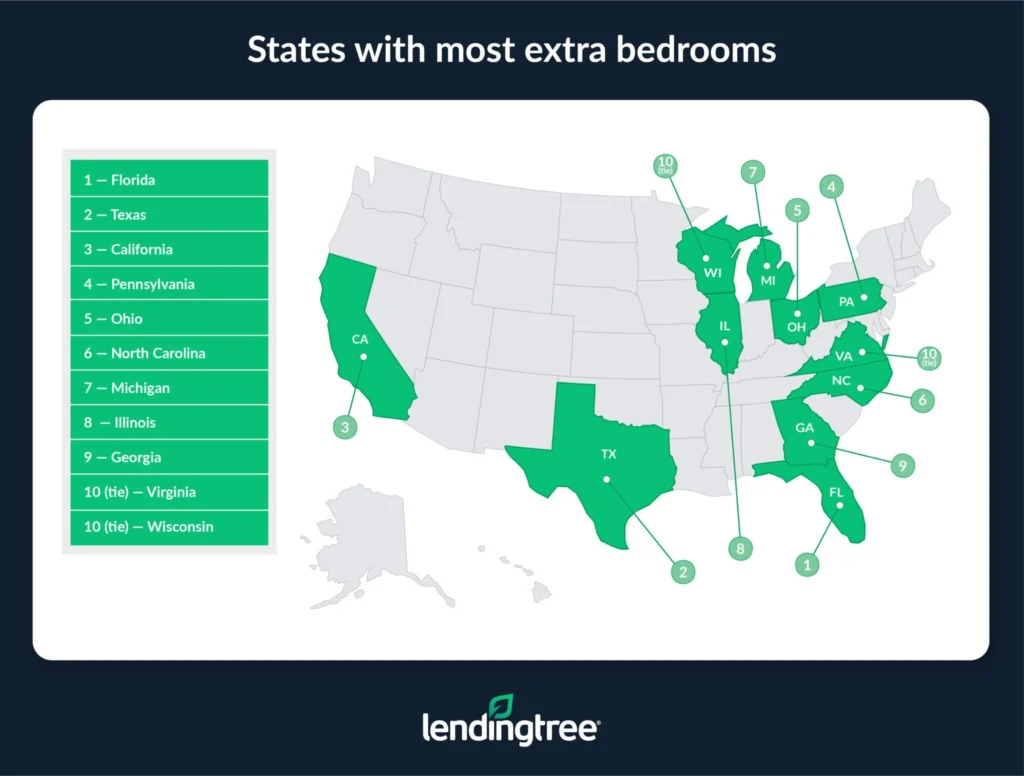
Meanwhile, New York state has 2.2 million fewer bedrooms than people who don’t live in group quarters. That makes it the only state with fewer bedrooms than residents. Despite New York’s lack of space, 31.4% of people live in homes with at least one extra bedroom — which may contribute to some overcrowding.
Taking a per-capita look, there are 289 extra bedrooms for every 1,000 U.S. residents who don’t live in group quarters (assuming one bedroom per person). By this look, Maine has the largest excess of bedrooms per 1,000 residents at 674. Vermont (630) and North Dakota (496) follow.
Each of the 10 states with the most extra bedrooms per capita (except for one, Montana) is among the 10 states with the lowest percentage of people in homes with more than two people per bedroom.
New York is again the only state in the negative, short 114 bedrooms for every 1,000 residents. Utah and the District of Columbia round out the bottom three, with 92 and 111 extra bedrooms per capita, respectively.
Full rankings: States with most/least extra bedrooms (millions)
| Rank | State | # of residents | # of bedrooms | # of extra bedrooms |
|---|---|---|---|---|
| 1 | Florida | 21.5 | 30.2 | 8.8 |
| 2 | Texas | 29.0 | 35.7 | 6.6 |
| 3 | California | 38.4 | 43.6 | 5.2 |
| 4 | Pennsylvania | 12.6 | 17.3 | 4.8 |
| 5 | Ohio | 11.5 | 15.8 | 4.3 |
| 6 | North Carolina | 10.3 | 14.4 | 4.1 |
| 7 | Michigan | 9.8 | 13.8 | 4.0 |
| 8 | Illinois | 12.4 | 16.3 | 3.9 |
| 9 | Georgia | 10.6 | 13.5 | 2.9 |
| 10 | Virginia | 8.4 | 11.0 | 2.5 |
| 10 | Wisconsin | 5.8 | 8.3 | 2.5 |
| 12 | Tennessee | 6.8 | 9.3 | 2.4 |
| 12 | Missouri | 6.0 | 8.4 | 2.4 |
| 14 | Arizona | 7.1 | 9.4 | 2.3 |
| 14 | Massachusetts | 6.8 | 9.0 | 2.3 |
| 16 | New Jersey | 9.1 | 11.3 | 2.2 |
| 16 | Indiana | 6.6 | 8.9 | 2.2 |
| 16 | Washington | 7.6 | 9.8 | 2.2 |
| 19 | South Carolina | 5.1 | 7.2 | 2.1 |
| 20 | Alabama | 4.9 | 6.9 | 2.0 |
| 20 | Minnesota | 5.6 | 7.6 | 2.0 |
| 22 | Colorado | 5.7 | 7.6 | 1.9 |
| 23 | Louisiana | 4.5 | 6.3 | 1.8 |
| 24 | Kentucky | 4.4 | 6.0 | 1.6 |
| 24 | Maryland | 6.0 | 7.6 | 1.6 |
| 26 | Oklahoma | 3.9 | 5.3 | 1.4 |
| 26 | Oregon | 4.1 | 5.5 | 1.4 |
| 28 | Arkansas | 2.9 | 4.1 | 1.2 |
| 28 | Iowa | 3.1 | 4.3 | 1.2 |
| 30 | Mississippi | 2.9 | 4.0 | 1.1 |
| 30 | Connecticut | 3.5 | 4.6 | 1.1 |
| 32 | Kansas | 2.9 | 3.9 | 1.0 |
| 33 | Maine | 1.3 | 2.2 | 0.9 |
| 34 | West Virginia | 1.7 | 2.6 | 0.8 |
| 34 | Nevada | 3.1 | 3.9 | 0.8 |
| 34 | New Mexico | 2.1 | 2.8 | 0.8 |
| 37 | Nebraska | 1.9 | 2.6 | 0.6 |
| 37 | New Hampshire | 1.3 | 1.9 | 0.6 |
| 39 | Montana | 1.1 | 1.6 | 0.5 |
| 39 | Idaho | 1.8 | 2.3 | 0.5 |
| 41 | Rhode Island | 1.1 | 1.5 | 0.4 |
| 41 | Delaware | 1.0 | 1.4 | 0.4 |
| 41 | Vermont | 0.6 | 1.0 | 0.4 |
| 41 | North Dakota | 0.8 | 1.1 | 0.4 |
| 45 | South Dakota | 0.9 | 1.2 | 0.3 |
| 45 | Utah | 3.3 | 3.6 | 0.3 |
| 45 | Hawaii | 1.4 | 1.7 | 0.3 |
| 45 | Alaska | 0.7 | 1.0 | 0.3 |
| 45 | Wyoming | 0.6 | 0.8 | 0.3 |
| 50 | District of Columbia | 0.6 | 0.7 | 0.1 |
| 51 | New York | 19.3 | 17.1 | -2.2 |
Full rankings: States with the most/least extra bedrooms per capita
| Rank | State | # of extra bedrooms per 1,000 residents |
|---|---|---|
| 1 | Maine | 674 |
| 2 | Vermont | 630 |
| 3 | North Dakota | 496 |
| 4 | West Virginia | 489 |
| 5 | Montana | 458 |
| 5 | Wyoming | 458 |
| 7 | New Hampshire | 435 |
| 7 | Wisconsin | 435 |
| 9 | South Carolina | 420 |
| 10 | Alabama | 413 |
| 11 | Florida | 410 |
| 12 | Arkansas | 407 |
| 13 | Missouri | 404 |
| 14 | Michigan | 403 |
| 15 | North Carolina | 402 |
| 16 | Mississippi | 399 |
| 17 | Delaware | 398 |
| 18 | Louisiana | 397 |
| 19 | Alaska | 396 |
| 20 | South Dakota | 392 |
| 21 | Rhode Island | 384 |
| 22 | Iowa | 382 |
| 23 | Pennsylvania | 380 |
| 24 | Ohio | 377 |
| 25 | New Mexico | 375 |
| 26 | Kentucky | 374 |
| 27 | Oklahoma | 364 |
| 28 | Tennessee | 358 |
| 29 | Minnesota | 356 |
| 30 | Kansas | 352 |
| 31 | Colorado | 342 |
| 32 | Nebraska | 339 |
| 33 | Massachusetts | 338 |
| 34 | Indiana | 336 |
| 35 | Oregon | 332 |
| 36 | Arizona | 327 |
| 37 | Connecticut | 316 |
| 38 | Illinois | 315 |
| 39 | Virginia | 302 |
| 40 | Washington | 290 |
| 41 | Georgia | 272 |
| 42 | Idaho | 264 |
| 43 | Maryland | 263 |
| 43 | Nevada | 263 |
| 45 | New Jersey | 246 |
| 46 | Texas | 229 |
| 47 | Hawaii | 205 |
| 48 | California | 136 |
| 49 | District of Columbia | 111 |
| 50 | Utah | 92 |
| 51 | New York | -114 |
Affording housing without overcrowding: Top expert tips
Overcrowding can be a simple solution to a common problem (affordability) for some, but that doesn’t mean Americans prefer it. There are other ways to cut costs without sharing a room with multiple people. Particularly, Schulz recommends:
- Flexibility is key. “Life is about prioritizing what matters,” he says. “If a big house is important to you, there are likely moves you can make to find one. However, it’ll require flexibility. Would you consider moving to another city? Would you be willing to take on a longer commute? Are you OK with changing your kids’ schools? Would you consider sacrificing other expenses to get the right home? Would you be willing to live with someone? These are just a few of the important questions to ask yourself.”
- Shop around. “It’s some of the oldest advice, but it’s incredibly important when it comes to home shopping,” he says. “With a mortgage, even just a fraction of a percentage point saved can equate to tens of thousands of dollars over the life of the loan. Those thousands can be the difference between being able to afford your dream home and being stuck with much less space than you need. It’s worth your time.”
- Determine your down payment first. To get a good sense of what your mortgage will look like and its affordability, use a mortgage calculator. That way, you can get a better sense of how much to put down.
Methodology
LendingTree researchers analyzed U.S. Census Bureau 2023 American Community Survey with five-year estimates microdata — the latest available — to estimate the following for each state and the District of Columbia:
- Living in overcrowded homes: The percentage of people living in housing units with more than two residents for each bedroom in the unit. For example, three people in a studio or one-bedroom, seven in a three-bedroom and 12 in a three-bedroom would count as 22 people in overcrowded homes.
- Living with extra bedrooms: The percentage of people living in housing units who live in homes with more bedrooms than people. For example, one person in a two-bedroom, three people in a four-bedroom and one person in a six-bedroom would be counted as five people with extra bedrooms. This doesn’t account for people who choose to share a room and leave any empty, so a couple in a two-bedroom wouldn’t be counted.
- Number of extra bedrooms: The total number of bedrooms minus the population, except for people living in correctional facilities, university or college housing, and nursing facilities. The total number of bedrooms was derived by multiplying the number of housing units — including vacant ones — by the average number of bedrooms in each state. This defines extra bedrooms as more than one per person and doesn’t account for couples who may share a room.
- Number of extra bedrooms per capita: This was calculated as the total number of bedrooms divided by the total population, except for people living in correctional facilities, university or college housing, and nursing facilities, which was then multiplied by 1,000.
View mortgage loan offers from up to 5 lenders in minutes