More Than 8 Million Adults in the US Aren’t Caught Up On Rent, While Nearly 3.6 Million Live Rent-Free
Even if U.S. home prices have cooled somewhat from their 2022 peaks, housing remains expensive.
The high cost of housing isn’t just relegated to homeowners, with renters feeling the sting of rising prices. In fact, based on our analysis of U.S. Census Bureau Household Pulse Survey data, LendingTree found that more than 8 million U.S. adults live in a household not caught up on rent payments.
But that isn’t the whole story — while millions of people are behind on their rent, about 3.6 million adults are living in households not being charged rent.
Read on to learn more about which states are home to the most people behind on rent, as well as the states with the most people living rent-free.
Key findings
- 8,070,524 people ages 18 or older in the U.S. aren’t caught up on rent payments. Put another way, 13.17% of the nation’s adult renters live in a household that charges them rent and are behind on payment.
- Nationwide, 3,560,345 adults — 5.81% of adult renters — live in a household that doesn’t pay rent. People in these types of households don’t own their home free and clear or with a mortgage, nor do they live with someone who does. Instead, they’re occupying some type of rental housing unit where rent isn’t paid or contracted. For example, people in these types of households could be caretakers provided their home rent-free in exchange for their services. In other words, people in these types of households aren’t living rent-free because they’re behind on rent; rather, they’re living rent-free because their household isn’t being charged rent.
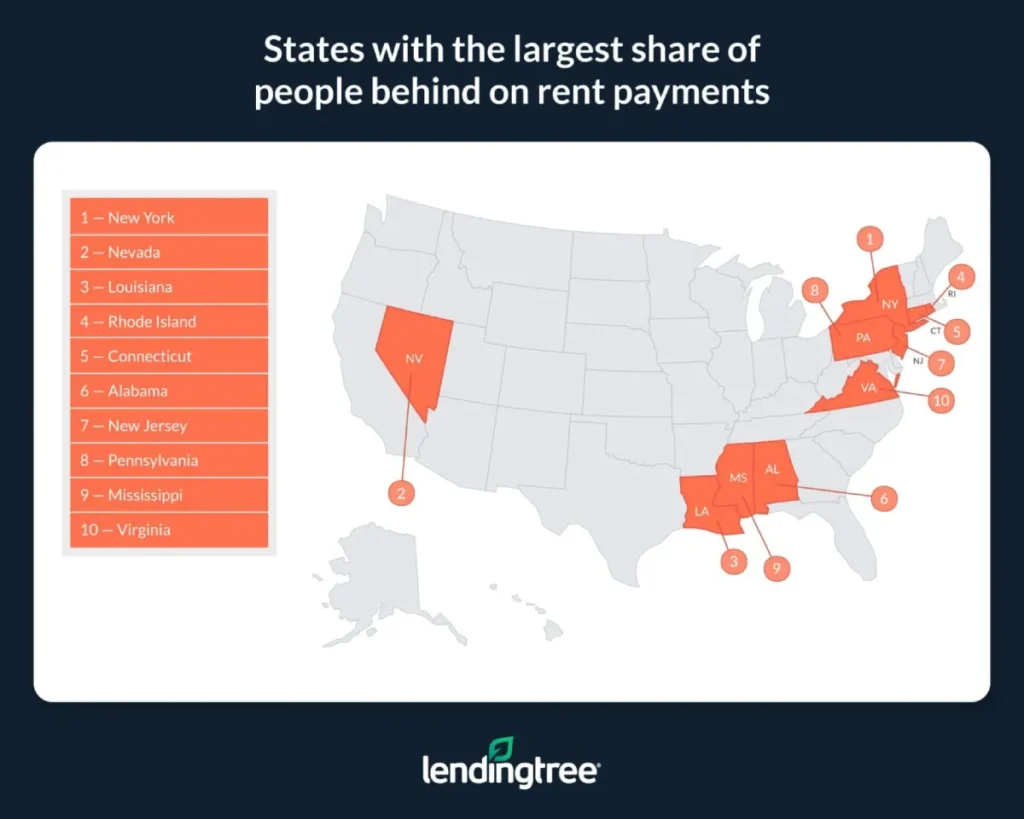
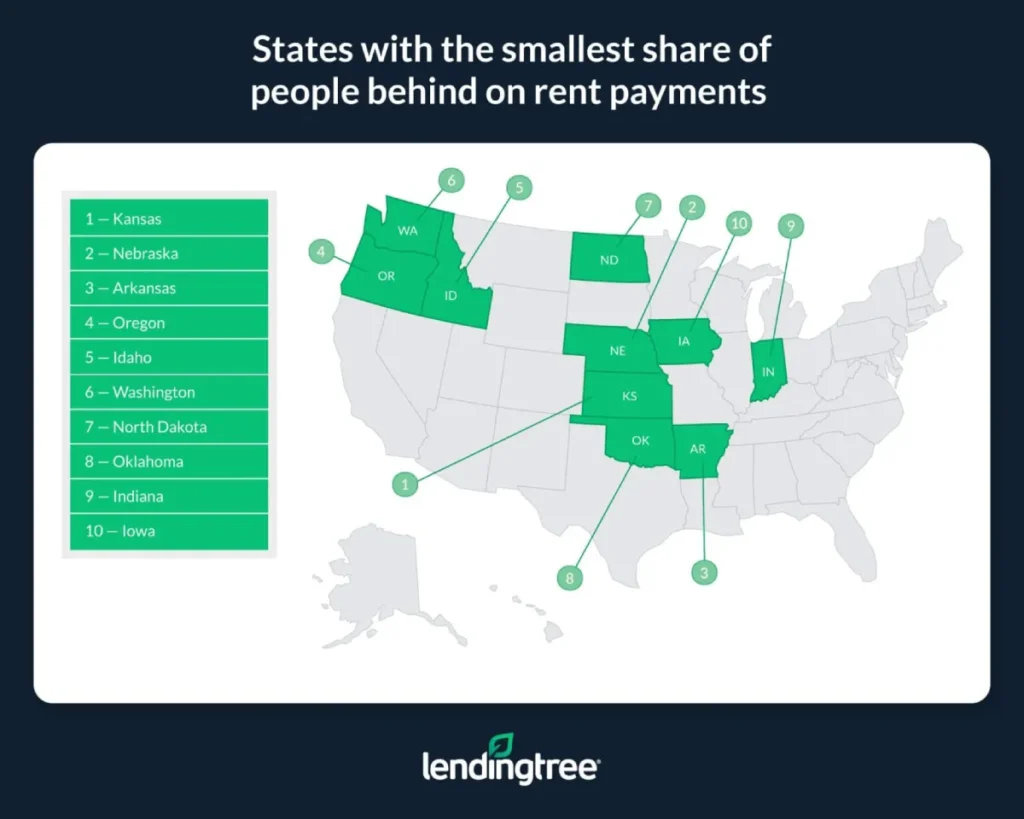
- The states with the largest share of adults behind on rent payments are New York, Nevada and Louisiana. Across these three states, an average of 19.72% of adult renters are living in households behind on rent payments. In the states with the smallest share of renters not caught up on rent — Kansas, Nebraska and Arkansas — that figure is 6.23%.
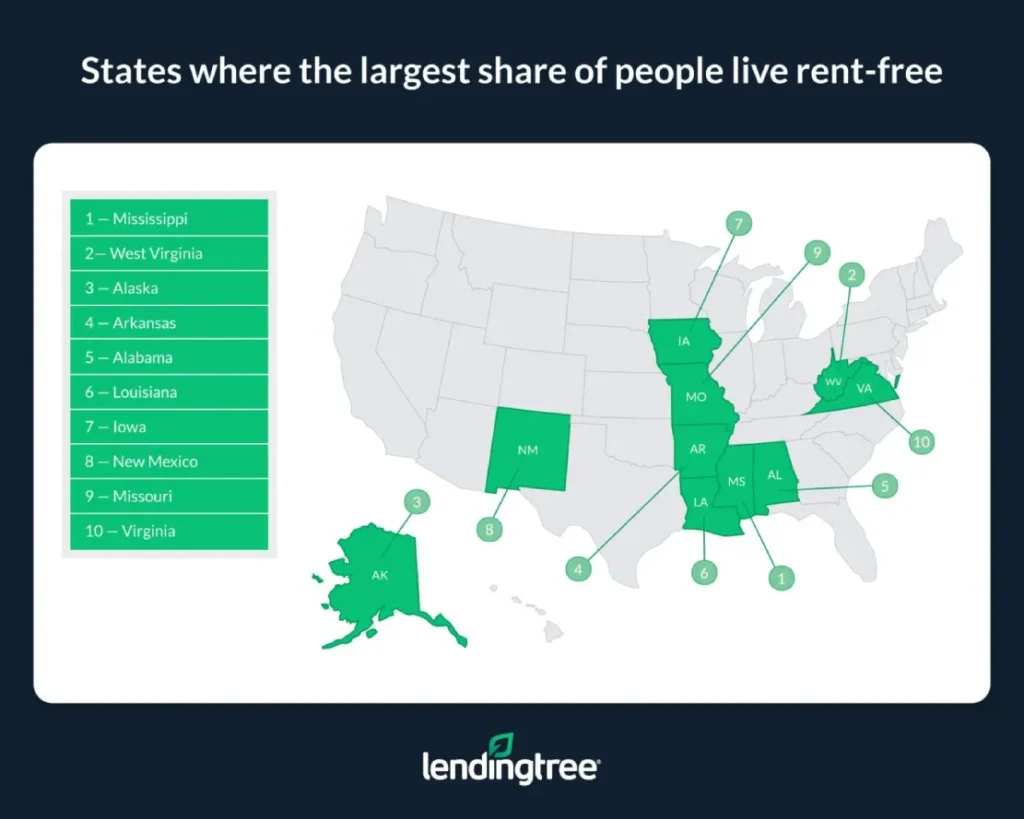
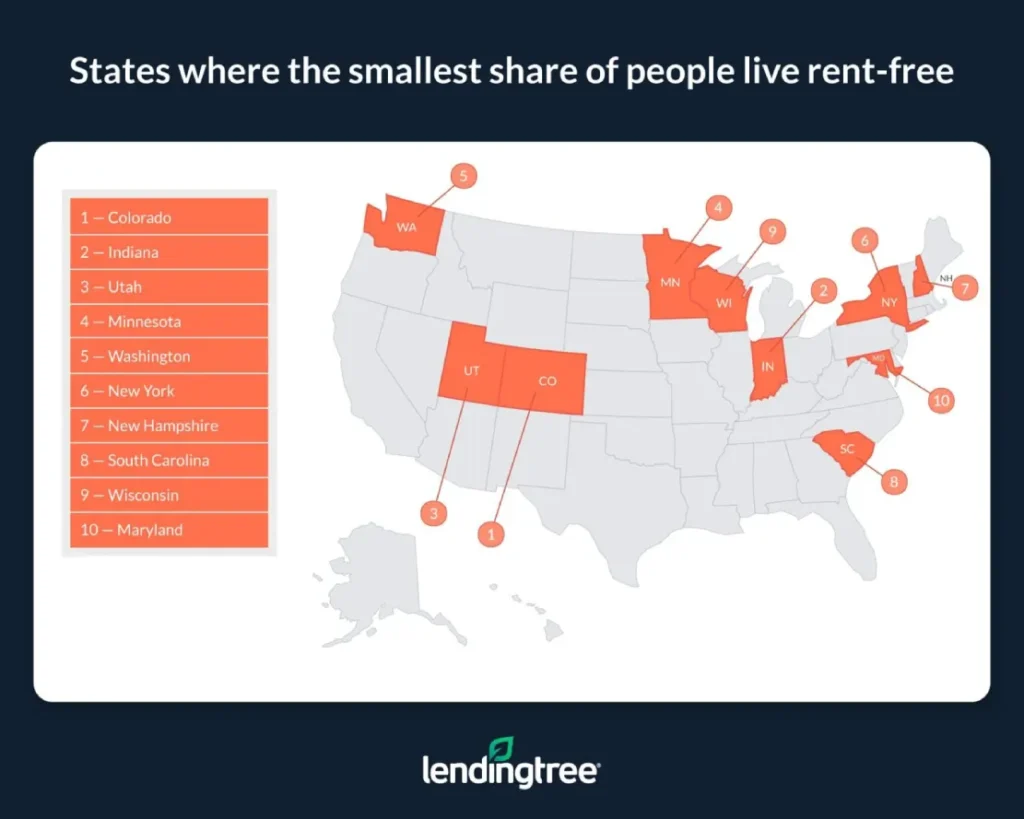
- Mississippi, West Virginia and Alaska are the states where the largest share of people live rent-free. In these three states, an average of 13.21% of adults live in renter-occupied households that aren’t paying rent. That’s more than 11 percentage points higher than in the states with the smallest share of renters living rent-free — Colorado, Indiana and Utah — where the average is 1.92%.
- Over the past year, 53.03% of renters across the U.S. saw their rent increase, while 36.91% saw no increase and 1.75% saw a decline. The majority of those who saw their rent payments jump reported increases between $100 and $249 a month.
States with the largest share of people behind on rent payments
No. 1: New York
- Adult population in renter-occupied households: 5,191,102
- Share of adults in renter-occupied households not caught up on rent: 20.52%
- Share of adults in renter-occupied households caught up on rent: 75.81%
- Share of adults in renter-occupied households occupied without rent: 2.73%
No. 2: Nevada
- Adult population in renter-occupied households: 768,883
- Share of adults in renter-occupied households not caught up on rent: 19.68%
- Share of adults in renter-occupied households caught up on rent: 74.99%
- Share of adults in renter-occupied households occupied without rent: 3.71%
No. 3: Louisiana
- Adult population in renter-occupied households: 525,160
- Share of adults in renter-occupied households not caught up on rent: 18.97%
- Share of adults in renter-occupied households caught up on rent: 68.89%
- Share of adults in renter-occupied households occupied without rent: 10.18%

States with the smallest share of people behind on rent payments
No. 1: Kansas
- Adult population in renter-occupied households: 442,806
- Share of adults in renter-occupied households not caught up on rent: 6.11%
- Share of adults in renter-occupied households caught up on rent: 88.37%
- Share of adults in renter-occupied households occupied without rent: 3.88%
No. 2: Nebraska
- Adult population in renter-occupied households: 305,917
- Share of adults in renter-occupied households not caught up on rent: 6.18%
- Share of adults in renter-occupied households caught up on rent: 88.26%
- Share of adults in renter-occupied households occupied without rent: 5.56%
No. 3: Arkansas
- Adult population in renter-occupied households: 509,017
- Share of adults in renter-occupied households not caught up on rent: 6.39%
- Share of adults in renter-occupied households caught up on rent: 79.80%
- Share of adults in renter-occupied households occupied without rent: 11.53%

States where the largest share of people live rent-free
No. 1: Mississippi
- Adult population in renter-occupied households: 511,819
- Share of adults in renter-occupied households occupied without rent: 14.90%
- Share of adults in renter-occupied households caught up on rent: 66.63%
- Share of adults in renter-occupied households not caught up on rent: 16.89%
No. 2: West Virginia
- Adult population in renter-occupied households: 188,382
- Share of adults in renter-occupied households occupied without rent: 12.76%
- Share of adults in renter-occupied households caught up on rent: 73.17%
- Share of adults in renter-occupied households not caught up on rent: 13.77%
No. 3: Alaska
- Adult population in renter-occupied households: 128,960
- Share of adults in renter-occupied households occupied without rent: 11.96%
- Share of adults in renter-occupied households caught up on rent: 75.87%
- Share of adults in renter-occupied households not caught up on rent: 11.84%

States where the smallest share of people live rent-free
No. 1: Colorado
- Adult population in renter-occupied households: 1,124,060
- Share of adults in renter-occupied households occupied without rent: 1.63%
- Share of adults in renter-occupied households caught up on rent: 86.89%
- Share of adults in renter-occupied households not caught up on rent: 10.23%
No. 2: Indiana
- Adult population in renter-occupied households: 1,022,897
- Share of adults in renter-occupied households occupied without rent: 2.02%
- Share of adults in renter-occupied households caught up on rent: 89.11%
- Share of adults in renter-occupied households not caught up on rent: 8.39%
No. 3: Utah
- Adult population in renter-occupied households: 591,183
- Share of adults in renter-occupied households occupied without rent: 2.11%
- Share of adults in renter-occupied households caught up on rent: 85.43%
- Share of adults in renter-occupied households not caught up on rent: 12.18%

Like buying, renting can be difficult in today’s housing market
Conversations about today’s housing market are often dominated by talk of how high home prices and mortgage rates have made becoming a homeowner considerably more challenging — but buying isn’t the only thing that’s become more difficult in recent years.
In the same way home prices have risen since the start of the pandemic, so too have rent costs. And while renting is typically cheaper than buying (at least in the short term), that doesn’t mean renting is always easy.
On the contrary, results for renters can vary significantly by household, as highlighted by our study’s findings that show that even though 13.17% of adults living in a renter-occupied household are behind on their payments, millions of others are living rent-free.
This shows that while successfully renting is far from impossible, navigating the nation’s rental market can be extremely challenging for many people.
For this reason, focusing solely on ways to make homebuying easier isn’t enough to alleviate the problems facing today’s housing market. Instead, we must consider ways to make renting easier, from building more affordable rental units to passing more laws that restrict predatory rent hikes. Otherwise, we would ignore the tens of millions of Americans who rent.
Tips for renters
Whether they’re in the market for a new place to live or trying to negotiate with their landlord, here are three tips for today’s renters.
- Don’t be afraid to talk with your landlord. If you’re worried you’ll fall behind on your rent or have already done so, immediately ask your landlord for help. While they’re probably not going to let you live rent-free, you may be able to negotiate better terms on your lease or get temporary relief from your monthly payments.
- In the face of losing your home, know your rights. Even if you don’t own your home, that doesn’t mean your landlord can force you to leave whenever they feel like it. If you’re facing eviction, familiarize yourself with your state’s eviction laws and don’t feel like you need to immediately leave because a landlord wants you out. Further, remember that housing discrimination is illegal no matter where in the country you live and that your landlord can’t refuse to stop renting to you for reasons related to your race, religion or gender.
- Recognize that other options, like buying, may be more accessible than you think. Though renting is typically cheaper in the short term than buying, that doesn’t mean buying is impossible for renters — even for those without great credit or a ton of cash. For example, plenty of mortgage options — like those backed by the Federal Housing Administration or Department of Veterans Affairs — can help borrowers get approved for a loan without a substantial down payment or an impeccable credit score.
Methodology
We analyzed data from Week 57 of the U.S. Census Bureau Household Pulse Survey, fielded Feb. 1 to Feb. 13, 2023 — the latest survey available at the time of writing.
Due to rounding and the share of the population that didn’t respond to the Census survey, some of the population percentages referenced in this study may not add to 100%. Further, because this data is based on responses gathered over a short period, some figures may have larger margins of error than typical Census data.
View mortgage loan offers from up to 5 lenders in minutes

