Empty but Expensive: Vacancy Rates in America’s Most Expensive Towns Top 23%
A March LendingTree study found more than 16 million vacant housing units in the U.S. This figure may seem steep but becomes more reasonable when you consider how many homes sit empty while they’re waiting to be rented or sold or their owners are staying in their primary residence.
While there are plenty of vacant homes in big cities, vacancy rates are often steeper in towns. With that in mind, LendingTree used U.S. Census Bureau 2020 American Community Survey data to analyze vacancy rates in the nation’s 50 most expensive micropolitan areas — referred to in this study as “towns” — with populations between 10,000 and 50,000.
More than 320,000 homes across the nation’s most expensive towns sit vacant. Of these homes, a bit more than two-thirds are empty because they’re only used for seasonal, recreational or occasional use.
Key findings
- Across the nation’s 50 most expensive towns, an average of 23.42% of homes are vacant. That translates to 320,346 empty houses.
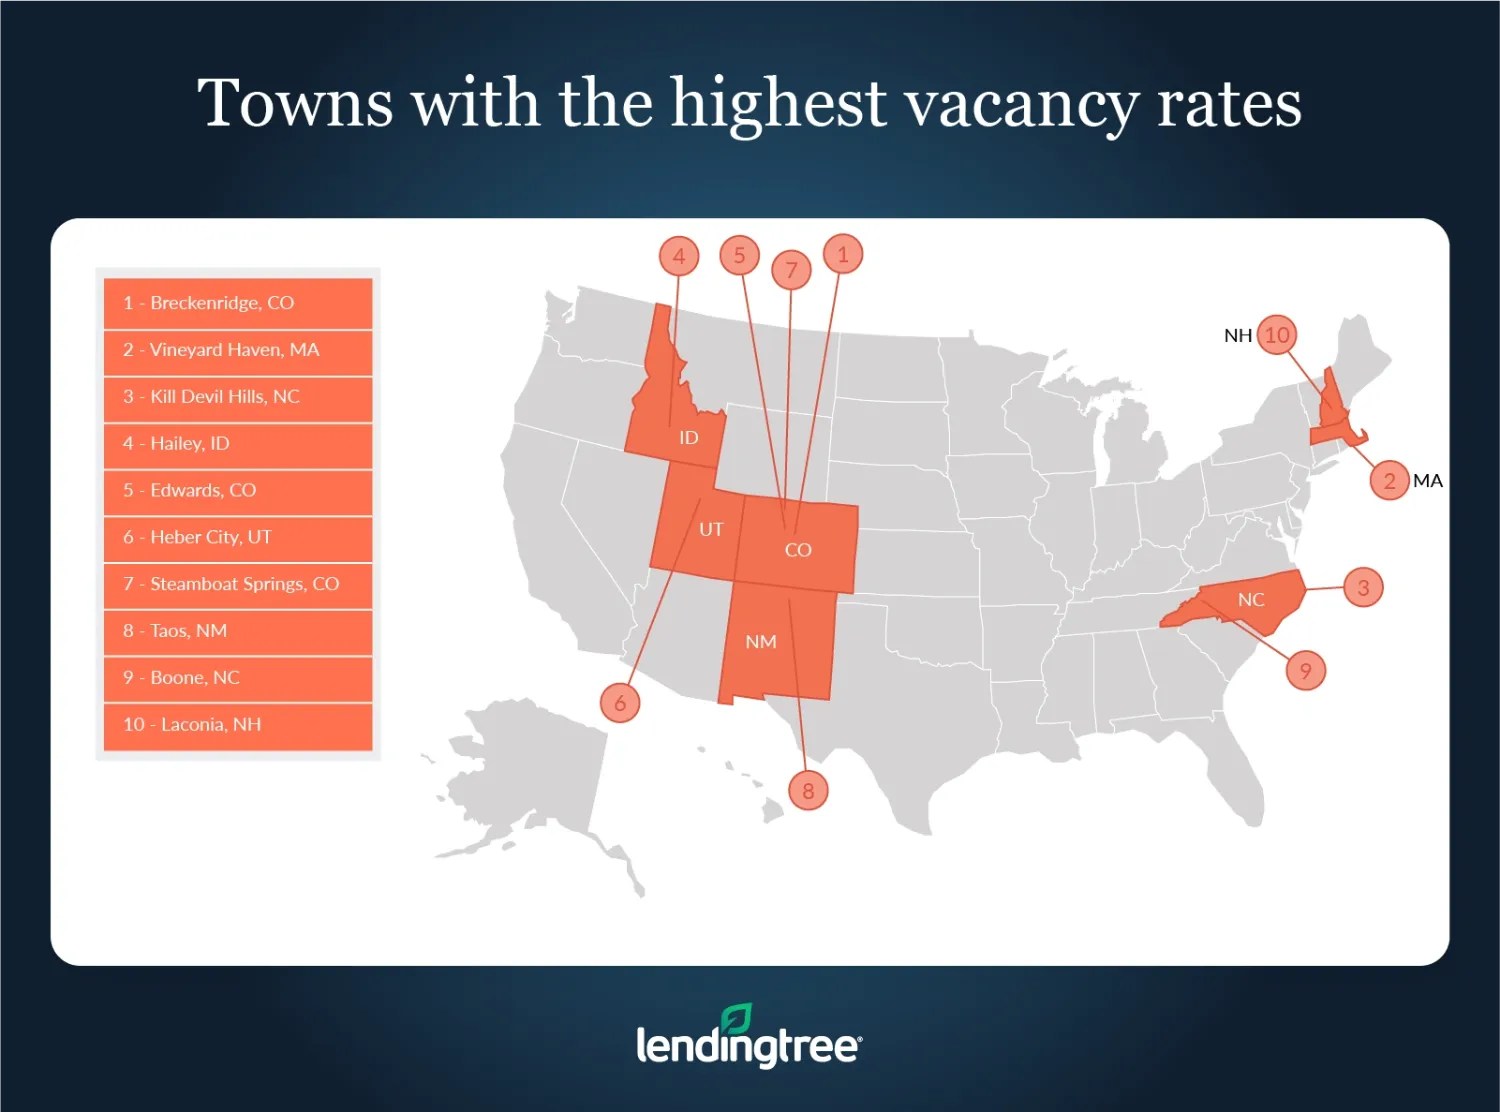
- Breckenridge, Colo., Vineyard Haven, Mass., and Kill Devil Hills, N.C., have the highest vacancy rates among the most expensive towns. An average of nearly 60% of all homes in these popular vacation and tourist destinations are vacant. Of those vacant homes, an average of 83.69% are unoccupied because they’re only used for seasonal, recreational or occasional use. In other words, vacation homes that go unused for most of the year are the main contributor to the high vacancy rates in these towns.
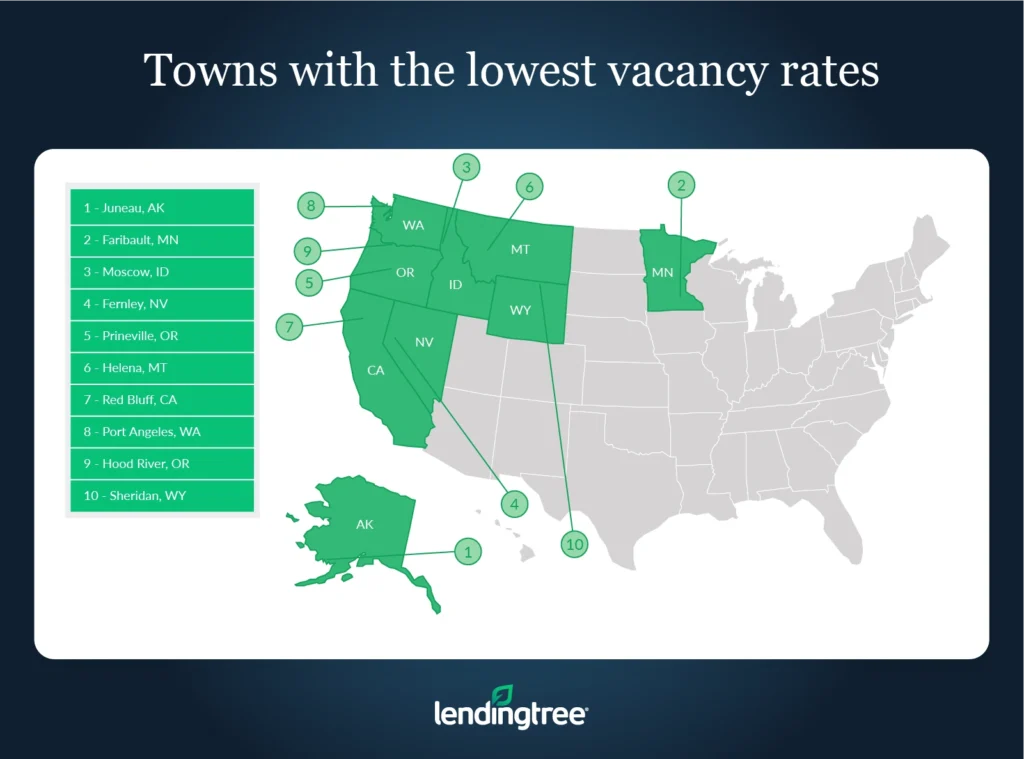
- Juneau, Alaska, Faribault, Minn., and Moscow, Idaho, have the lowest vacancy rates among the most expensive towns. An average of only 7.54% of homes in these towns are vacant — 15.88 percentage points lower than the average vacancy rate of 23.42% across the nation’s 50 most expensive towns.
- Homes across the country’s most expensive towns are most likely to be vacant because they’re only used for seasonal, recreational or occasional use. An average of 58.88% of the vacant homes analyzed in our study are empty for that reason.
- Towns with higher vacancy rates tend to have more expensive homes than those with lower vacancy rates. Median home values in the 10 towns with the highest vacancy rates are an average of $177,190 more expensive than median home values in the 10 towns with the lowest vacancy rates. While exceptions exist, the main reason for this likely stems from how buyers are often willing to spend top dollar on vacation homes they don’t live in year-round.
Towns with the highest vacancy rates
1. Breckenridge, Colo.
- Total number of housing units: 31,158
- Overall vacancy rate: 62.74%
- Most common reason why homes are vacant: Used for seasonal, recreational or occasional use
- Percentage of homes that are vacant for most common reason: 93.83%
- Median home value: $596,300
2. Vineyard Haven, Mass.
- Total number of housing units: 18,030
- Overall vacancy rate: 61.80%
- Most common reason why homes are vacant: Used for seasonal, recreational or occasional use
- Percentage of homes that are vacant for most common vacancy reason: 96.15%
- Median home value: $794,000
3. Kill Devil Hills, N.C.
- Total number of housing units: 35,007
- Overall vacancy rate: 54.78%
- Most common reason why homes are vacant: Used for seasonal, recreational or occasional use
- Percentage of homes that are vacant for most common vacancy reason: 61.10%
- Median home value: $297,200

Towns with the lowest vacancy rates
1. Juneau, Alaska
- Total number of housing units: 13,792
- Overall vacancy rate: 6.63%
- Most common reason why homes are vacant: Other
- Percentage of homes that are vacant for most common vacancy reason: 37.86%
- Median home value: $355,100
2. Faribault, Minn.
- Total number of housing units: 25,161
- Overall vacancy rate: 7.86%
- Most common reason why homes are vacant: Other
- Percentage of homes that are vacant for most common vacancy reason: 42.21%
- Median home value: $232,800
3. Moscow, Idaho
- Total number of housing units: 17,132
- Overall vacancy rate: 8.14%
- Most common reason why homes are vacant: Other
- Percentage of homes that are vacant for most common vacancy reason: 49.61%
- Median home value: $245,200

How can home prices be high in towns with high vacancy rates?
On the surface, it may be tempting to assume a high vacancy rate means there isn’t a lot of demand for housing in a given area. And, as a result, home prices in that area would be lower than in an area with a lower vacancy rate. However, this isn’t always the case. In fact, our study illustrates the opposite is often true.
Homes aren’t necessarily vacant because they’re unwanted. Instead, houses can be considered vacant because they’re not in use. For example, a pricey vacation home sitting empty because its owner is at their primary residence would be considered vacant, as would a recently sold home that isn’t quite move-in ready.
Because of this, an area’s vacancy rate alone can’t show the popularity of a given housing market or how expensive it’s likely to be. Of course, that doesn’t mean an area’s vacancy rate isn’t important or can’t shed light on what’s happening within a specific market.
High vacancy rates and high home prices can suggest that an area has a strong housing market but many people live elsewhere for most of the year. This is commonly the case in resort towns like Breckenridge, Colo. High vacancy rates and low home prices, on the other hand, could mean that a housing market is struggling and there isn’t much demand for housing.
If vacancy rates are low and housing prices are high, it could signify that the market is very competitive and that there isn’t enough housing supply to satisfy demand. If both vacancy rates and home prices are low, it could mean that demand is high but sellers are selling their homes for less than what they could have gotten.
Ultimately, understanding vacancy rates is important to understanding the overall housing market. But to appreciate what a vacancy rate means, you must look behind the facade at the reasons why homes are vacant.
Tips for buying a home in a small town
With remote work becoming more normalized, many people may think about moving to a small town to save money or escape a hectic city lifestyle. While some towns are calmer and cheaper than cities, not all are. With that in mind, homebuyers should consider the following tips to be better prepared before buying a house in a small town:
- Shop around for a lender. Because different lenders can offer different rates to the same borrowers, it’s often possible to find a lower rate by shopping around for a mortgage before you buy a home. A lower rate can help you afford a more expensive house and/or lower your monthly mortgage payments.
- Don’t assume you’ll be spending less. Smaller towns can be expensive — even those that aren’t necessarily common vacation destinations. Depending on where you’re planning to move, a home in a town could cost the same (if not more) as a home in a big city. This can be especially true in more rural towns where builders may not have the incentive to construct large numbers of middle-class homes, meaning that buyers often have to engage in stiff competition with one another for a limited number of houses on the market.
- Learn about the area before you move. Like anywhere else, towns are home to unique benefits and drawbacks. For example, towns are often not as walkable as cities. Beyond that, things that people depend on in emergencies like hospitals or fire departments may not be as well-funded or equipped as those in big cities. As a result, if you decide to move to an area without fully understanding what it does or doesn’t have to offer, you could make yourself miserable. Town life isn’t necessarily simpler or more “idyllic” than city life.
Methodology
The data used in this study comes from the U.S. Census Bureau 2020 American Community Survey (with five-year estimates). LendingTree used micropolitan-level data for areas with a population between 10,000 and 50,000 to approximate town-level data.
The survey measures the overall vacancy rate in an area by dividing the number of vacant households by the total number of households. Occupied households include homes owned or rented by occupants who use the home as their primary residence, while vacant households are broken down into seven subcategories. The U.S. Census Bureau defines the subcategories as follows:
- For rent: Vacant units offered “for rent,” or vacant units offered for either sale or rent.
- Rented, not occupied: Vacant units where a rental agreement has been reached but the future occupants haven’t moved in yet.
- For sale only: Vacant units currently on the market.
- Sold, not occupied: Similar to “rented, not occupied,” homes that have sold, but the new owner hasn’t moved in yet.
- For seasonal, recreational or occasional use: Homes for seasonal use like beach cottages and hunting cabins or lodging for seasonal workers like herders and loggers. Timeshare condominiums are also included.
- For migrant workers: Homes for migrant workers to occupy while they’re employed in farmwork during the crop season.
- Other vacant: Vacant homes that don’t fall into any other category. Includes houses that an owner doesn’t wish to live in, rent or sell, houses that are being used for storage, houses that belong to an older adult living with family or at an assisted-care facility, houses being held for settlement of an estate, houses being renovated or repaired, and homes that are being foreclosed.
View mortgage loan offers from up to 5 lenders in minutes

