US Mortgage Statistics 2026: Debt, Delinquency and Foreclosure Data
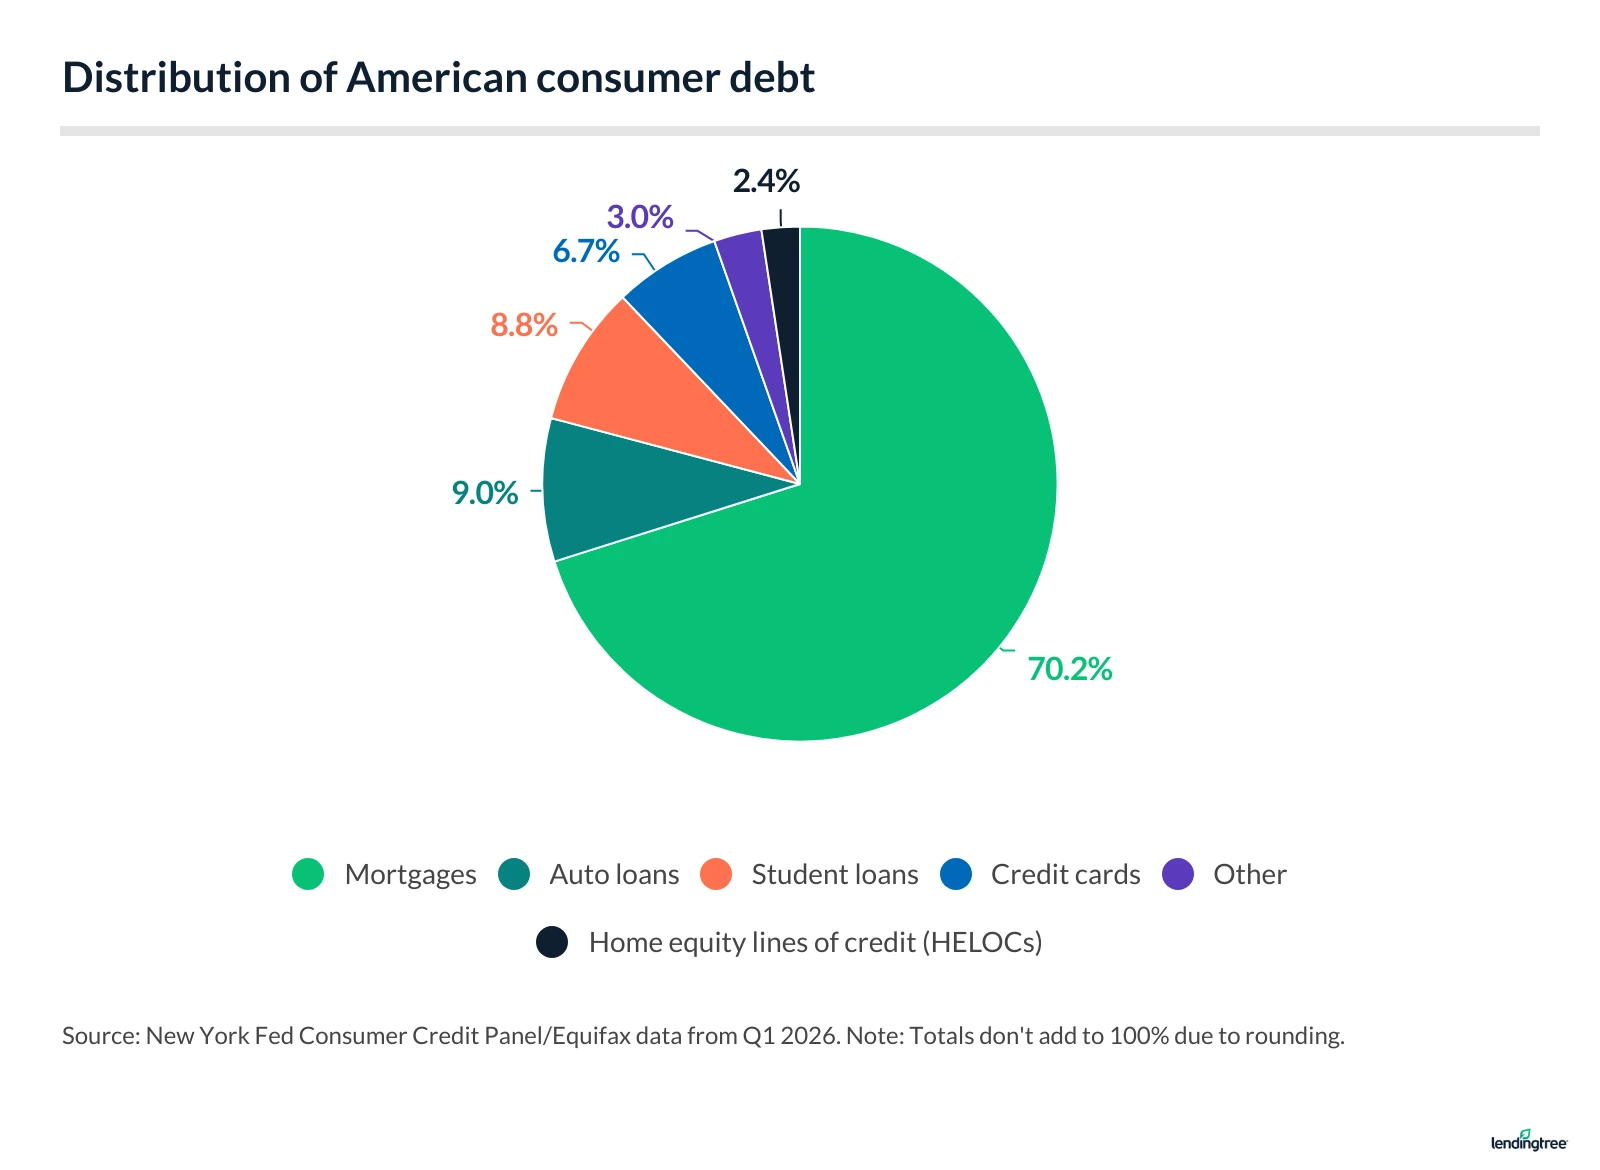
Americans collectively owe $13.19 trillion in mortgage debt, accounting for 70.2% of total U.S. consumer debt. Just 1.09% of mortgage debt is seriously delinquent, suggesting mortgage borrowers are generally meeting their repayment obligations.
This page examines total mortgage debt, the number and size of mortgages, and key loan performance metrics such as delinquency and foreclosure rates to provide an overview of the U.S. mortgage market.
- Americans owe $13.19 trillion in mortgage debt, which accounts for 70.2% of total U.S. consumer debt.
- There are 86.97 million mortgage accounts, with an average balance of $151,673.
- 1.09% of U.S. mortgage debt is seriously delinquent.
- 227,360 consumers experienced a new foreclosure in 2025, up from 174,100 in 2024. In the first quarter of 2026, 59,160 consumers experienced a new foreclosure.
Outstanding mortgage debt
Outstanding U.S. mortgage debt has increased by $3.48 trillion since Q1 2020, reaching $13.19 trillion in Q1 2026, the latest period for which data is available. This increase reflects rising home prices and continued mortgage borrowing over the past six years.
Mortgages account for 70.2% of total U.S. consumer debt, making them the largest category of U.S. household debt.
The number of mortgage accounts increased to 86.97 million in Q1 2026 from 81.10 million in Q1 2020. Over the same period, the average mortgage balance rose from $119,766 to $151,673 per account.
Outstanding mortgages: 10-year look
| Quarter | Accounts* (millions) | Balance ($ trillions) | Avg. balance per account |
|---|---|---|---|
| Q1 2026 | 86.97 | $13.19 | $151,673 |
| Q1 2025 | 85.78 | $12.80 | $149,266 |
| Q1 2024 | 84.94 | $12.44 | $146,456 |
| Q1 2023 | 84.00 | $12.04 | $143,381 |
| Q1 2022 | 81.51 | $11.18 | $137,161 |
| Q1 2021 | 80.41 | $10.16 | $126,352 |
| Q1 2020 | 81.10 | $9.71 | $119,766 |
| Q1 2019 | 79.92 | $9.24 | $115,666 |
| Q1 2018 | 79.90 | $8.94 | $111,877 |
| Q1 2017 | 80.11 | $8.63 | $107,689 |
Mortgage delinquencies: Rates and trends over time
In Q1 2026, 1.09% of U.S. mortgage balances were seriously delinquent, meaning payments were at least 90 days past due.
This figure is up from 0.86% in Q1 2025 and continues a stretch of year-over-year Q1 increases since 2023, when the percentage was 0.44%.
Seriously delinquent rate: 10-year look
| Quarter | Seriously delinquent rate |
|---|---|
| Q1 2026 | 1.09% |
| Q1 2025 | 0.86% |
| Q1 2024 | 0.60% |
| Q1 2023 | 0.44% |
| Q1 2022 | 0.47% |
| Q1 2021 | 0.59% |
| Q1 2020 | 1.06% |
| Q1 2019 | 1.00% |
| Q1 2018 | 1.22% |
| Q1 2017 | 1.67% |
Mortgage delinquency remains low compared with some other forms of consumer debt. By comparison, 13.12% of credit card borrowers were seriously delinquent in Q1 2026, suggesting financial stress is more concentrated in unsecured borrowing.
Mortgage foreclosure: Rates and trends over time
In 2025, 227,360 consumers entered foreclosure, up 30.6% from 174,100 in 2024. The increase indicates that foreclosure activity accelerated after a period of relative stability. In the first quarter of 2026, 59,160 consumers entered foreclosure.
Number of new foreclosures: 10-year trend
| Year | Foreclosures |
|---|---|
| 2026 | 59,160 |
| 2025 | 227,360 |
| 2024 | 174,100 |
| 2023 | 150,820 |
| 2022 | 122,140 |
| 2021 | 38,040 |
| 2020 | 129,000 |
| 2019 | 277,560 |
| 2018 | 284,360 |
| 2017 | 314,220 |
Despite the year-over-year increase, foreclosure activity remains well below recent historical levels. The 2025 total was 33.0% lower than the 339,200 foreclosures recorded in 2016.
Source
- Federal Reserve Bank of New York: Quarterly Report on Household Debt and Credit (Q1 2026), released in May 2026
View mortgage loan offers from up to 5 lenders in minutes