Less Than 5% of People With Mortgages Are Under 30 in Nation’s Biggest Metros
Becoming a homeowner has always been a major milestone for Americans. In fact, many Gen Zers put off other milestones like marriage and children to buy a house first.
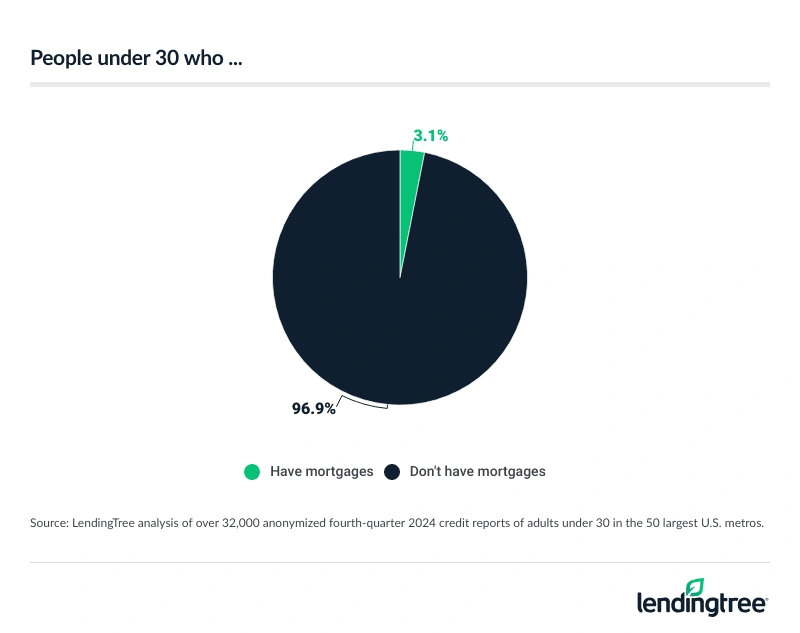
It’s not always that simple, though. A LendingTree study of anonymized credit reports of users on our platform finds that only 3.1% of Americans younger than 30 have a mortgage in the 50 largest U.S. metros.
However, that figure varies from 9.4% to 0.8% depending on the metro. Here’s our look at under-30 homeowners.
Key findings
- Only 3.1% of adults younger than 30 have a mortgage in the 50 largest U.S. metros, but that varies considerably. 9.4% of under-30s have mortgages in Nashville, Tenn., as well as 8.4% in Indianapolis and 7.0% in Pittsburgh. Conversely, just 0.8% do in San Jose, Calif., as well as 1.2% in New York and 1.3% in Los Angeles. Some or all of this variance may be due to generally lower homeownership rates in these larger, more expensive metros.
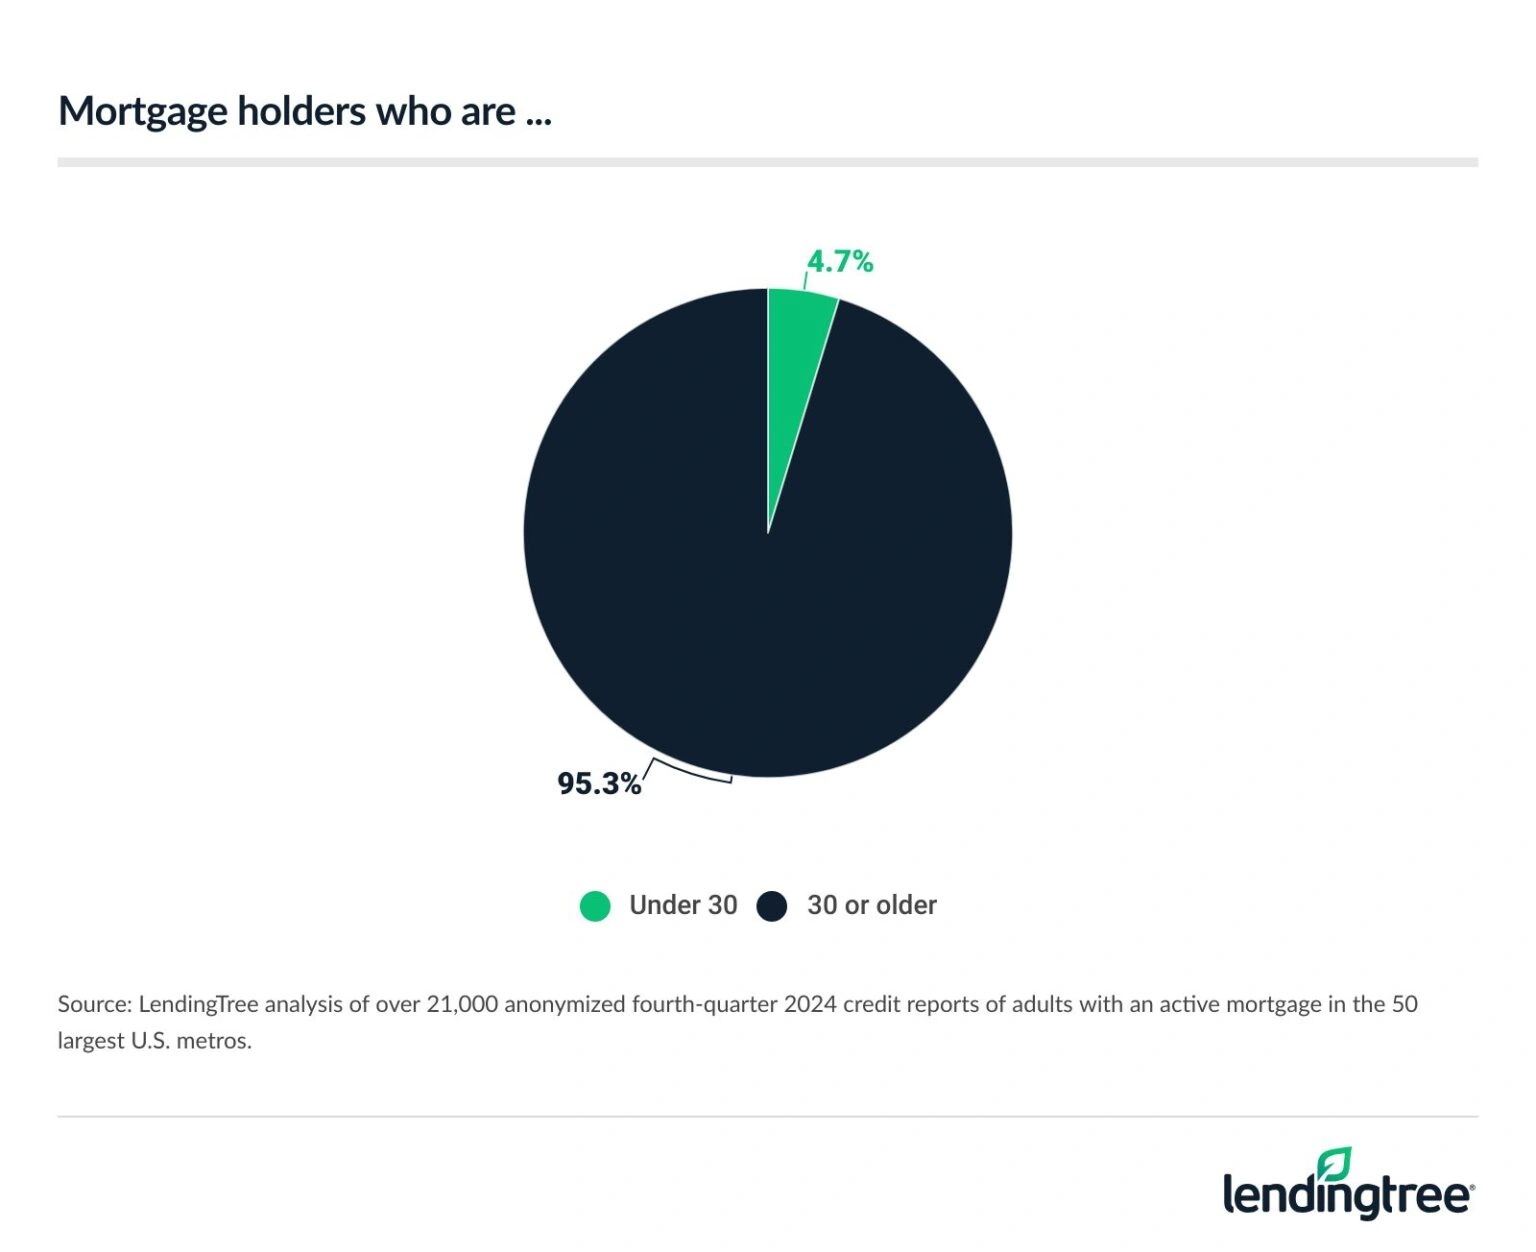
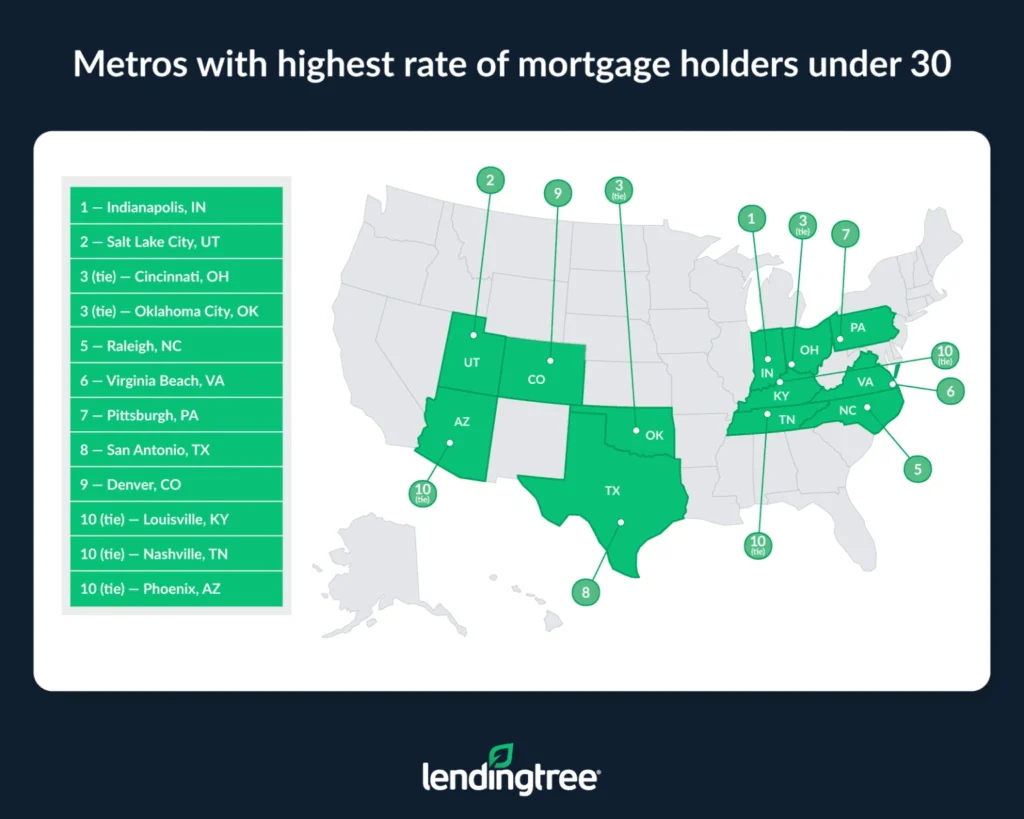
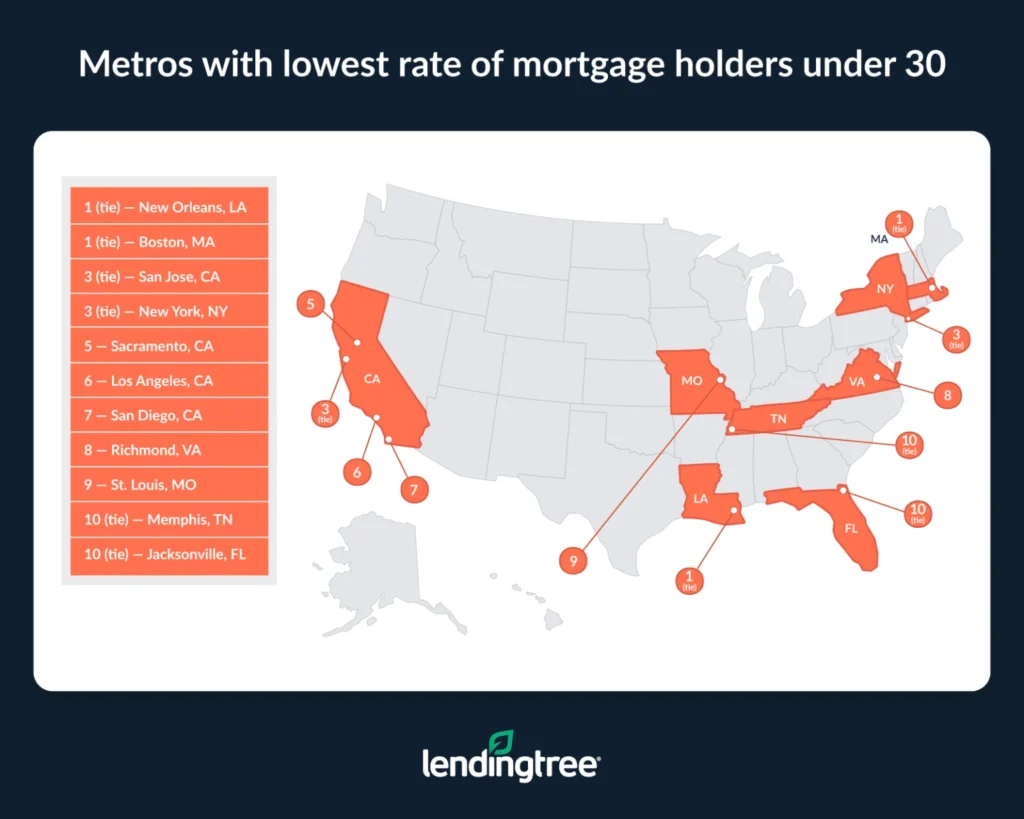
- People younger than 30 make up 4.7% of mortgage holders in the 50 largest metros, despite comprising 20.3% of the adult population in those same metros. The rate is highest in Indianapolis (where under-30s make up 10.2% of mortgage holders), Salt Lake City (9.4%), Cincinnati (8.9%) and Oklahoma City (8.9%). Meanwhile, the rate is lowest in New Orleans (2.2%), Boston (2.2%), San Jose (2.3%) and New York (2.3%).
- Prospective buyers under 30 look for houses that only cost a quarter of the average price that older prospective buyers look at. Younger buyers on the LendingTree platform looked for mortgages to purchase homes in the 50 largest metros costing an average of $92,332 in 2024. That’s 74.9% lower than the average of $367,681 from older buyers. The trend was most pronounced in Providence, R.I., where younger buyers looked to mortgage homes 88.0% less costly than those of older buyers, followed by Charlotte, N.C. (86.1% cheaper), and San Francisco (84.1% cheaper). At the other end are Buffalo, N.Y. (58.0% cheaper), Milwaukee (58.5% cheaper) and Salt Lake City (60.9% cheaper).
- Overall, people 18 to 29 owe a total of $527 billion in mortgage debt, or 4.2% of all mortgage debt. When looking at all debt owed by this age group, mortgages comprise 44.6% of it — far lower than other age groups. For example, people 30 to 39 hold $2.7 trillion, or 21.5%, in outstanding mortgage debt, comprising 68.6% of their entire debt load.


Metros with largest share of under-30s with mortgages
No. 1: Nashville, Tenn.
- % of under-30s with mortgages: 9.4%
No. 2: Indianapolis
- % of under-30s with mortgages: 8.4%
No. 3: Pittsburgh
- % of under-30s with mortgages: 7.0%
Metros with smallest share of under-30s with mortgages
No. 1: San Jose, Calif.
- % of under-30s with mortgages: 0.8%
No. 2: New York
- % of under-30s with mortgages: 1.2%
No. 3: Los Angeles
- % of under-30s with mortgages: 1.3%
Metros with largest/smallest share of under-30s with mortgages
| Rank | Metro | % |
|---|---|---|
| 1 | Nashville, TN | 9.4% |
| 2 | Indianapolis, IN | 8.4% |
| 3 | Pittsburgh, PA | 7.0% |
| 4 | Cincinnati, OH | 6.5% |
| 5 | Louisville, KY | 5.8% |
| 6 | Oklahoma City, OK | 5.7% |
| 7 | San Antonio, TX | 5.3% |
| 8 | Hartford, CT | 5.0% |
| 9 | Virginia Beach, VA | 4.9% |
| 10 | Buffalo, NY | 4.7% |
| 10 | Salt Lake City, UT | 4.7% |
| 12 | Raleigh, NC | 4.6% |
| 13 | Detroit, MI | 4.5% |
| 14 | Minneapolis, MN | 4.3% |
| 14 | Phoenix, AZ | 4.3% |
| 14 | Providence, RI | 4.3% |
| 17 | Birmingham, AL | 4.1% |
| 18 | Memphis, TN | 4.0% |
| 19 | Denver, CO | 3.7% |
| 19 | Las Vegas, NV | 3.7% |
| 21 | New Orleans, LA | 3.5% |
| 21 | Riverside, CA | 3.5% |
| 23 | Houston, TX | 3.4% |
| 24 | Cleveland, OH | 3.3% |
| 25 | Baltimore, MD | 3.2% |
| 25 | Dallas, TX | 3.2% |
| 25 | Tampa, FL | 3.2% |
| 28 | Charlotte, NC | 3.1% |
| 28 | Chicago, IL | 3.1% |
| 28 | Philadelphia, PA | 3.1% |
| 31 | Miami, FL | 3.0% |
| 31 | St. Louis, MO | 3.0% |
| 33 | Kansas City, MO | 2.9% |
| 34 | Austin, TX | 2.8% |
| 34 | Columbus, OH | 2.8% |
| 36 | Orlando, FL | 2.6% |
| 36 | Seattle, WA | 2.6% |
| 38 | Jacksonville, FL | 2.5% |
| 38 | Milwaukee, WI | 2.5% |
| 40 | Washington, DC | 2.4% |
| 41 | Atlanta, GA | 2.3% |
| 42 | Portland, OR | 2.2% |
| 43 | Richmond, VA | 2.1% |
| 44 | San Francisco, CA | 2.0% |
| 45 | San Diego, CA | 1.7% |
| 46 | Sacramento, CA | 1.6% |
| 47 | Boston, MA | 1.4% |
| 48 | Los Angeles, CA | 1.3% |
| 49 | New York, NY | 1.2% |
| 50 | San Jose, CA | 0.8% |
Metros with highest rate of mortgage holders under 30
No. 1: Indianapolis
- % of mortgage holders under 30: 10.2%
No. 2: Salt Lake City
- % of mortgage holders under 30: 9.4%
No. 3: Cincinnati and Oklahoma City
- % of mortgage holders under 30: 8.9%

Metros with lowest rate of mortgage holders under 30
No. 1: New Orleans and Boston
- % of mortgage holders under 30: 2.2%
No. 3: San Jose, Calif., and New York
- % of mortgage holders under 30: 2.3%

Metros with highest/lowest rate of mortgage holders under 30
| Rank | Metro | % |
|---|---|---|
| 1 | Indianapolis, IN | 10.2% |
| 2 | Salt Lake City, UT | 9.4% |
| 3 | Cincinnati, OH | 8.9% |
| 3 | Oklahoma City, OK | 8.9% |
| 5 | Raleigh, NC | 8.2% |
| 6 | Virginia Beach, VA | 8.0% |
| 7 | Pittsburgh, PA | 7.3% |
| 8 | San Antonio, TX | 7.1% |
| 9 | Denver, CO | 7.0% |
| 10 | Louisville, KY | 6.4% |
| 10 | Nashville, TN | 6.4% |
| 10 | Phoenix, AZ | 6.4% |
| 13 | Birmingham, AL | 6.3% |
| 14 | Detroit, MI | 6.2% |
| 15 | Buffalo, NY | 6.0% |
| 15 | Seattle, WA | 6.0% |
| 17 | Hartford, CT | 5.5% |
| 18 | Charlotte, NC | 5.4% |
| 18 | Houston, TX | 5.4% |
| 18 | Miami, FL | 5.4% |
| 21 | Minneapolis, MN | 5.2% |
| 22 | Columbus, OH | 5.1% |
| 22 | Las Vegas, NV | 5.1% |
| 24 | Dallas, TX | 5.0% |
| 25 | Austin, TX | 4.7% |
| 25 | Providence, RI | 4.7% |
| 25 | San Francisco, CA | 4.7% |
| 28 | Cleveland, OH | 4.6% |
| 29 | Orlando, FL | 4.5% |
| 29 | Riverside, CA | 4.5% |
| 31 | Atlanta, GA | 4.3% |
| 31 | Chicago, IL | 4.3% |
| 31 | Washington, DC | 4.3% |
| 34 | Kansas City, MO | 4.1% |
| 35 | Baltimore, MD | 4.0% |
| 35 | Portland, OR | 4.0% |
| 37 | Milwaukee, WI | 3.9% |
| 37 | Philadelphia, PA | 3.9% |
| 37 | Tampa, FL | 3.9% |
| 40 | Jacksonville, FL | 3.8% |
| 40 | Memphis, TN | 3.8% |
| 42 | St. Louis, MO | 3.7% |
| 43 | Richmond, VA | 3.6% |
| 44 | San Diego, CA | 3.3% |
| 45 | Los Angeles, CA | 3.2% |
| 46 | Sacramento, CA | 2.5% |
| 47 | New York, NY | 2.3% |
| 47 | San Jose, CA | 2.3% |
| 49 | Boston, MA | 2.2% |
| 49 | New Orleans, LA | 2.2% |
Metros with largest value difference in homes sought by under-30 and older homebuyers
No. 1: Providence, R.I.
- Average home value among prospective buyers under 30: $92,768
- Average home value among prospective buyers 30 and older: $775,543
- $ difference: $682,775
- % difference: 88.0%
No. 2: Charlotte, N.C.
- Average home value among prospective buyers under 30: $115,565
- Average home value among prospective buyers 30 and older: $831,067
- $ difference: $715,502
- % difference: 86.1%
No. 3: San Francisco
- Average home value among prospective buyers under 30: $133,602
- Average home value among prospective buyers 30 and older: $842,458
- $ difference: $708,856
- % difference: 84.1%
Metros with smallest value difference in homes sought by under-30 and older homebuyers
No. 1: Buffalo, N.Y.
- Average home value among prospective buyers under 30: $71,649
- Average home value among prospective buyers 30 and older: $170,417
- $ difference: $98,768
- % difference: 58.0%
No. 2: Milwaukee
- Average home value among prospective buyers under 30: $96,290
- Average home value among prospective buyers 30 and older: $232,112
- $ difference: $135,822
- % difference: 58.5%
No. 3: Salt Lake City
- Average home value among prospective buyers under 30: $150,601
- Average home value among prospective buyers 30 and older: $384,926
- $ difference: $234,325
- % difference: 60.9%
Metros with largest/smallest value difference in homes sought by under-30s and older homebuyers
| Rank | Metro | Value, under 30 | Value, 30 and older | $ difference | % difference |
|---|---|---|---|---|---|
| 1 | Providence, RI | $92,768 | $775,543 | $682,775 | 88.0% |
| 2 | Charlotte, NC | $115,565 | $831,067 | $715,502 | 86.1% |
| 3 | San Francisco, CA | $133,602 | $842,458 | $708,856 | 84.1% |
| 4 | Las Vegas, NV | $70,228 | $359,363 | $289,135 | 80.5% |
| 5 | San Jose, CA | $178,995 | $872,986 | $693,991 | 79.5% |
| 6 | Richmond, VA | $70,768 | $333,889 | $263,121 | 78.8% |
| 7 | Miami, FL | $88,317 | $411,783 | $323,466 | 78.6% |
| 8 | Washington, DC | $106,218 | $490,894 | $384,676 | 78.4% |
| 9 | Sacramento, CA | $94,076 | $429,416 | $335,340 | 78.1% |
| 10 | Riverside, CA | $89,427 | $403,185 | $313,758 | 77.8% |
| 11 | Orlando, FL | $70,927 | $317,155 | $246,228 | 77.6% |
| 12 | Los Angeles, CA | $150,642 | $670,836 | $520,194 | 77.5% |
| 13 | Seattle, WA | $123,316 | $543,958 | $420,642 | 77.3% |
| 14 | Atlanta, GA | $78,362 | $342,616 | $264,254 | 77.1% |
| 14 | Jacksonville, FL | $66,424 | $290,302 | $223,878 | 77.1% |
| 14 | New York, NY | $111,587 | $488,224 | $376,637 | 77.1% |
| 17 | San Diego, CA | $147,230 | $636,854 | $489,624 | 76.9% |
| 18 | Virginia Beach, VA | $64,193 | $276,333 | $212,140 | 76.8% |
| 19 | Memphis, TN | $58,062 | $247,825 | $189,763 | 76.6% |
| 20 | Houston, TX | $69,544 | $295,557 | $226,013 | 76.5% |
| 21 | Baltimore, MD | $80,187 | $333,861 | $253,674 | 76.0% |
| 22 | Tampa, FL | $72,045 | $294,432 | $222,387 | 75.5% |
| 23 | Raleigh, NC | $87,561 | $349,515 | $261,954 | 74.9% |
| 24 | New Orleans, LA | $63,119 | $250,885 | $187,766 | 74.8% |
| 25 | Portland, OR | $98,357 | $388,787 | $290,430 | 74.7% |
| 26 | San Antonio, TX | $65,996 | $257,190 | $191,194 | 74.3% |
| 27 | Dallas, TX | $86,545 | $330,025 | $243,480 | 73.8% |
| 28 | Chicago, IL | $84,405 | $308,293 | $223,888 | 72.6% |
| 29 | Austin, TX | $105,665 | $378,282 | $272,617 | 72.1% |
| 30 | Boston, MA | $146,593 | $521,123 | $374,530 | 71.9% |
| 31 | Philadelphia, PA | $84,442 | $298,111 | $213,669 | 71.7% |
| 32 | Phoenix, AZ | $99,413 | $348,534 | $249,121 | 71.5% |
| 33 | Nashville, TN | $105,351 | $364,036 | $258,685 | 71.1% |
| 34 | St. Louis, MO | $64,136 | $219,256 | $155,120 | 70.7% |
| 35 | Denver, CO | $128,100 | $429,341 | $301,241 | 70.2% |
| 36 | Hartford, CT | $81,476 | $271,966 | $190,490 | 70.0% |
| 37 | Detroit, MI | $67,096 | $214,463 | $147,367 | 68.7% |
| 38 | Birmingham, AL | $68,403 | $216,030 | $147,627 | 68.3% |
| 39 | Cleveland, OH | $64,218 | $201,034 | $136,816 | 68.1% |
| 40 | Pittsburgh, PA | $62,654 | $192,423 | $129,769 | 67.4% |
| 41 | Oklahoma City, OK | $66,764 | $201,508 | $134,744 | 66.9% |
| 42 | Louisville, KY | $69,652 | $206,352 | $136,700 | 66.2% |
| 43 | Kansas City, MO | $80,409 | $232,350 | $151,941 | 65.4% |
| 44 | Columbus, OH | $87,236 | $245,962 | $158,726 | 64.5% |
| 45 | Minneapolis, MN | $103,428 | $282,410 | $178,982 | 63.4% |
| 46 | Indianapolis, IN | $83,128 | $222,152 | $139,024 | 62.6% |
| 47 | Cincinnati, OH | $81,632 | $210,590 | $128,958 | 61.2% |
| 48 | Salt Lake City, UT | $150,601 | $384,926 | $234,325 | 60.9% |
| 49 | Milwaukee, WI | $96,290 | $232,112 | $135,822 | 58.5% |
| 50 | Buffalo, NY | $71,649 | $170,417 | $98,768 | 58.0% |
Mortgage debt by age group
18 to 29
- Outstanding mortgage debt: $527 billion
- % of total mortgage debt: 4.2%
- % of age group’s total debt: 44.6%
30 to 39
- Outstanding mortgage debt: $2.71 trillion
- % of total mortgage debt: 21.5%
- % of age group’s total debt: 68.6%
40 to 49
- Outstanding mortgage debt: $3.41 trillion
- % of total mortgage debt: 27.1%
- % of age group’s total debt: 73.3%
50 to 59
- Outstanding mortgage debt: $2.84 trillion
- % of total mortgage debt: 22.6%
- % of age group’s total debt: 72.6%
60 to 69
- Outstanding mortgage debt: $1.91 trillion
- % of total mortgage debt: 15.2%
- % of age group’s total debt: 73.0%
70+
- Outstanding mortgage debt: $1.18 trillion
- % of total mortgage debt: 9.4%
- % of age group’s total debt: 73.8%
What’s driving this trend?
Historically, we’ve heard that many young people aim to buy houses in their mid-to-late 20s as they’re looking to start a family and build wealth. So why do such a small percentage of under-30s make up mortgage holders in the 50 largest metros?
According to Matt Schulz — LendingTree chief consumer finance analyst and author of “Ask Questions, Save Money, Make More: How to Take Control of Your Financial Life” — a few factors are at play.
“Rising home prices and consistently high interest rates, combined with stubborn overall inflation, have made homeownership little more than a pipe dream for many Americans,” he says. “That’s especially true for 20-somethings, who may also be struggling with relatively new student loan debt. It’s nothing short of a shame.”
That’s especially true in the nation’s biggest metros.
“Sure, big-metro dwellers may have higher incomes than their rural or suburban counterparts, but the cost of living and cost of housing can be so astronomically high that it eats up all that extra income — and then some,” Schulz says. “Also, if you’re able to find a home you can afford to buy, it may be so far from your workplace that you spend large amounts of money commuting. It all adds up to a challenging situation leading many young people to forgo homeownership altogether.”
It all adds up to a challenging situation leading many young people to forgo homeownership altogether.
Expert tips for young homebuyers
While getting a mortgage at a young age is no easy feat, there are a few things young homebuyers should keep in mind when taking that step. Particularly, Schulz recommends:
- Shop around. There can be significant differences in the terms offered among different lenders, including interest rates. When you’re talking about perhaps the biggest purchase you’ll ever make, even a fraction of a percentage point difference in rates can mean thousands of dollars paid over the life of a loan. “It’s absolutely, positively worth your time to shop around for a mortgage,” he says.
- Consider different types of mortgages. “If a conventional 30-year, fixed-rate mortgage with a 20% down payment isn’t realistic for you, which is the case for millions of Americans, don’t give up hope,” Schulz says. Plenty of other options could be worth considering. “It’s essential you understand the fine print associated with these various types of mortgages. There’s just too much money at stake to enter into them carelessly. However, if you’re committed to pursuing the dream of homeownership, take heart in the fact that you can take more than one path.”
- Plan. While it may sound obvious, it’s important to make sure you can afford to become a homeowner. A mortgage calculator can help you better understand your monthly payments, which can help you envision your budget and whether you can afford a mortgage quite yet.
Methodology
To estimate the percentage of adults younger than 30 with mortgages, LendingTree researchers analyzed a representative sample of over 32,000 anonymized fourth-quarter 2024 credit reports of people born between 1995 and 2006 who live in the 50 largest U.S. metros by population. Rates for all 50 metros, combined, were weighted by relevant age-cohort population from the U.S. Census 2023 American Community Survey with five-year estimates.
To estimate the percentage of mortgage holders under 30, LendingTree researchers analyzed a representative sample of over 21,000 anonymized fourth-quarter 2024 credit reports of people with active mortgage loans who live in the 50 largest metros by population. People 30 or older were born in 1994 or earlier, while those under 30 were born between 1995 and 2006. Rates for all 50 metros, combined, were weighted by relevant age-cohort population from the U.S. Census 2023 American Community Survey with five-year estimates.
Analysts captured the average home prices sought from about 260,000 inquiries completed on the LendingTree platform in the 2024 calendar year for a home purchase loan in the 50 largest metros by population. People 30 and older were at least 30 on the date they completed the inquiry, while those younger than 30 were between 18 and 29 on the date they completed the inquiry.
Researchers analyzed data from the New York Fed Consumer Credit Panel/Equifax for the third quarter of 2024 (the most recent available) to calculate the total outstanding mortgage debt.
View mortgage loan offers from up to 5 lenders in minutes


