14.5 Million US Homes Are Vacant — Here Are the States With the Highest Vacancy Rates


The U.S. has far more vacant homes than many might expect. In fact, 14.5 million U.S. homes — roughly 1 in 10 nationwide — are empty.
But vacancy doesn’t always mean availability. Some empty units are used seasonally, while others are available for rent — and fewer than 800,000 are listed for sale. The differences in vacancy type help explain why housing can feel scarce even when millions of homes sit empty.
LendingTree analyzed U.S. Census Bureau data to see where vacancy rates are highest, how they’ve changed over time and what they may reveal about local housing markets.
- 14.5 million U.S. homes — roughly 1 in 10 — are vacant. Of those, 4.7 million are used seasonally or recreationally, 2.6 million are available to rent and fewer than 800,000 are listed for sale.
- Not all vacant homes are the same. In Vermont, 75.8% of vacant homes are seasonal or recreational properties, meaning about 1 in 7 homes statewide sit empty in the offseason. In the District of Columbia, 39.4% of vacant homes are available for rent — the highest share in the nation.
- Maine has the nation’s highest vacancy rate at 20.6%, followed by Vermont (19.4%) and Alaska (17.6%). In contrast, Connecticut has the lowest vacancy rate in the country at 7.0%, followed by Washington (7.3%). California, New Jersey and Oregon are all tied at 7.5%.
- The national vacancy rate fell by 0.31 percentage points, or about 302,000 homes, between 2023 and 2024. Wyoming (down 1.23 percentage points), North Dakota (down 1.03 points) and Rhode Island (down 0.72 points) saw the biggest declines. Meanwhile, the vacancy rate increased in just two states: the District of Columbia (up 0.42 points) and Oregon (up 0.05 points).
- Homes tend to cost more in states with lower vacancy rates. The states with the lowest vacancy rates have an average median home value of $435,118, which is $167,678 higher than the average in states with the highest vacancy rates. However, Alaska, Florida and New Hampshire rank among the high-vacancy states while still having home values above the national median of $332,700.
About 1 in 10 U.S. homes sit vacant
An estimated 14.5 million homes in the U.S. are currently vacant, representing 10.1% of the nation’s housing supply.
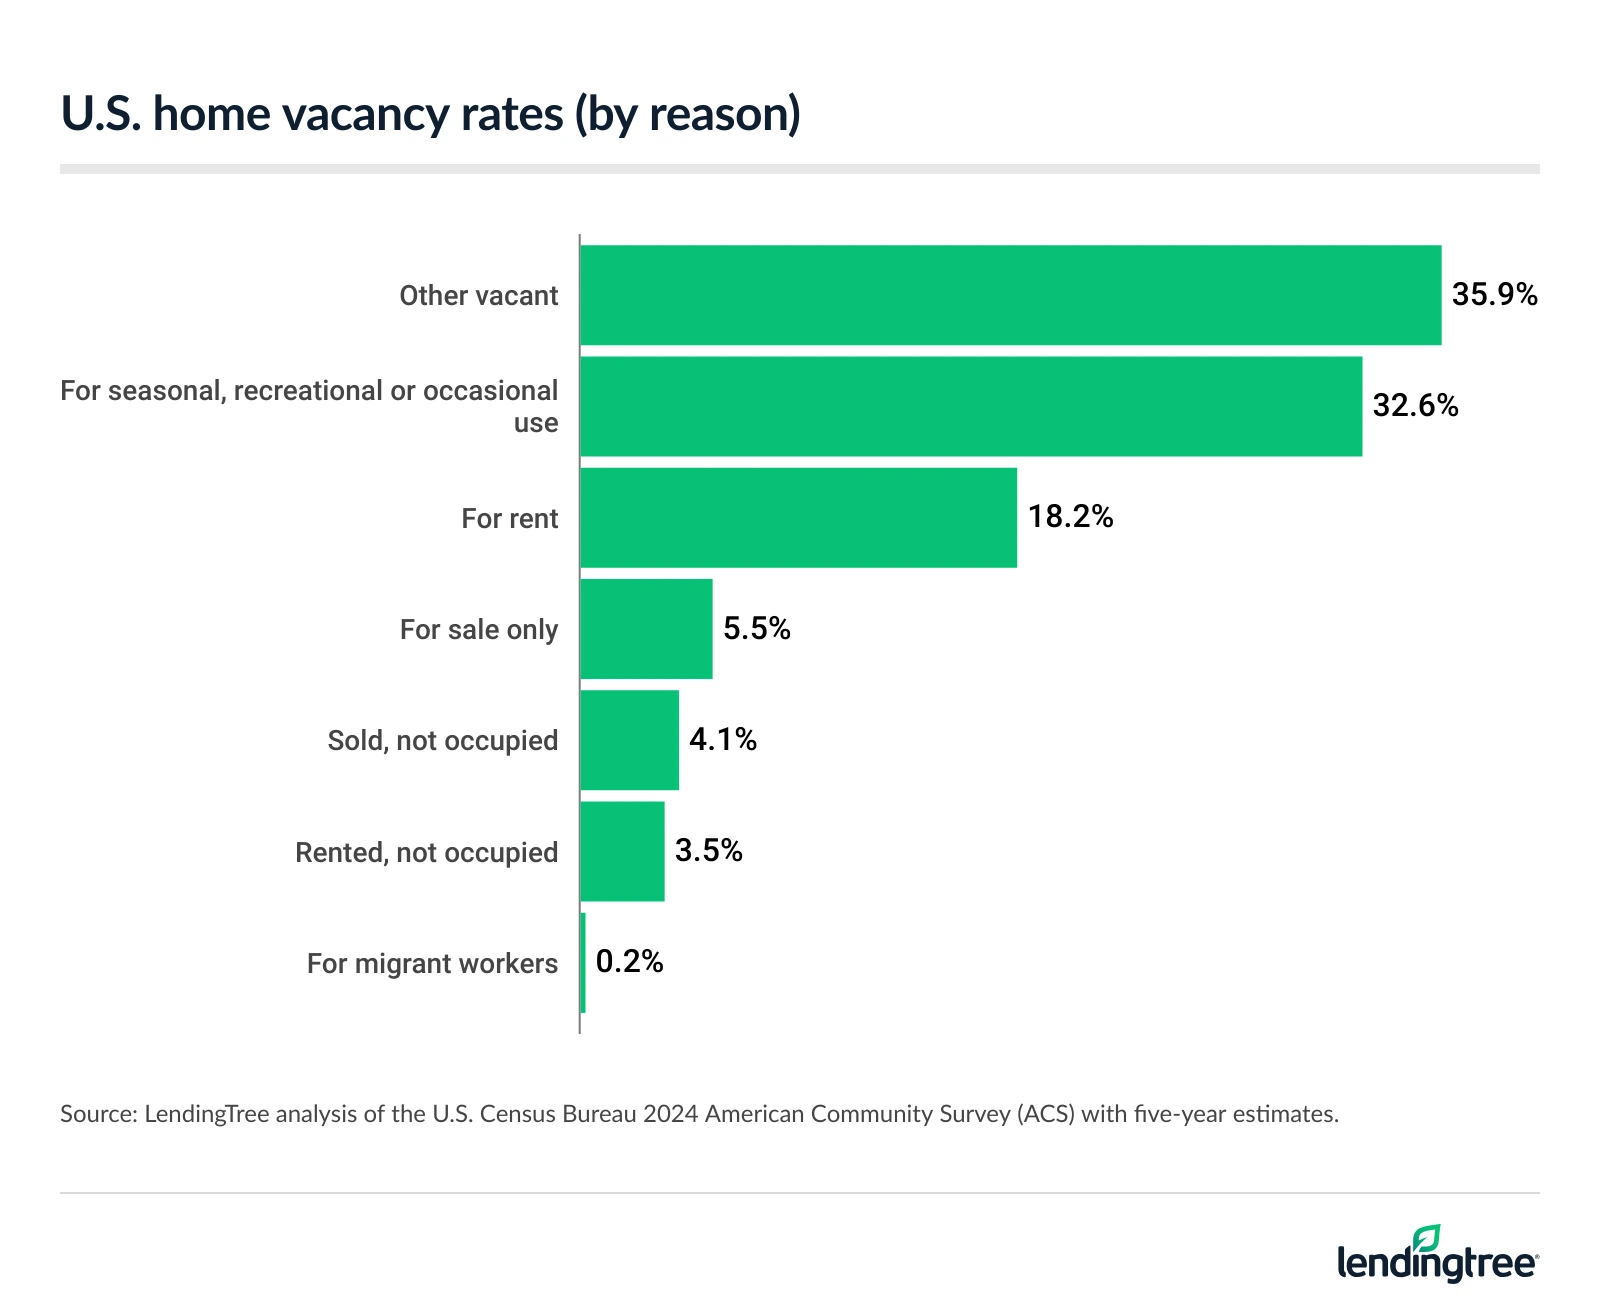
Of those 14.5 million vacant homes, 4.7 million (32.6%) are used seasonally or recreationally, such as vacation homes. Another 2.6 million (18.2%) are available for rent, while just under 800,000 (5.5%) are listed for sale. The remaining vacant homes fall into other categories, such as properties that are sold or rented but not yet occupied, housing reserved for workers or units being held off the market.
Housing economists often use vacancy rates as a gauge of supply and demand in local housing markets. Higher vacancy rates can indicate weaker demand or an oversupply of housing, which may lead to a drop in home prices and rents. Lower vacancy rates, meanwhile, may signal a tighter homebuying environment in which available properties are limited relative to demand, potentially pushing prices higher.
Generally, a vacancy rate between 7% and 8% is considered consistent with a balanced real estate market, providing enough available housing to accommodate buyers and renters without creating significant shortages or surpluses. Notably, the significance of a local market’s vacancy rate depends on the unique characteristics of that market.
“A healthy level of vacancy is generally a good thing because it gives buyers and renters more options and helps reduce competition for available homes,” says Matt Schulz, LendingTree chief consumer finance analyst and author of “Ask Questions, Save Money, Make More: How to Take Control of Your Financial Life.”
“However, as our report shows, not all vacant homes are available to people looking for housing. A key question isn’t how many homes are vacant, but how many are available for someone to buy or rent.”
Vacancy reasons vary by state
The U.S. Census Bureau classifies a home as vacant if it’s unoccupied and habitable, but the reasons properties sit empty vary considerably by state.
In Vermont, for example, 75.8% of vacant homes are seasonal or recreational properties. As a result, 14.7% of the state’s housing units are empty during the offseason. In the District of Columbia, meanwhile, the largest share of vacancies is tied to the rental market. Homes available for rent make up 39.4% of the district’s vacant units — the highest such share in the nation — representing 4.0% of all housing units.
Other states have unique vacancy patterns, too. In Illinois, 8.2% of vacant homes are listed for sale, while another 6.1% have been sold but aren’t yet occupied. In North Dakota, 2.1% of vacant units are designated for migrant workers — the highest share among all states.
States with the highest types of vacancy rates
| Vacancy type | State with the highest share | Share of vacant homes in state | % of all homes in that state |
|---|---|---|---|
| For seasonal, recreational or occasional use | Vermont | 75.8% | 14.7% |
| Other vacant | Mississippi | 62.5% | 9.1% |
| For rent | District of Columbia | 39.4% | 4.0% |
| Rented, not occupied | District of Columbia | 8.6% | 0.9% |
| For sale only | Illinois | 8.2% | 0.6% |
| Sold, not occupied | Illinois | 6.1% | 0.5% |
| For migrant workers | North Dakota | 2.1% | 0.3% |
These differences highlight why vacancy rates should be viewed in context. A high vacancy rate driven by vacation homes may reflect a thriving seasonal tourism market, while a high share of homes available for rent or sale can point to very different housing market dynamics.
“When a large share of vacant homes are seasonal or recreational properties, it doesn’t necessarily help local families looking for housing because those homes aren’t typically available year-round,” Schulz says. “That’s very different from vacancies that are available for rent or sale, which can ease pressure on the market and give consumers more choices.
“In areas dominated by seasonal homes, housing can feel scarce despite relatively high vacancy rates on paper. For prospective buyers, that can mean fewer homes to choose from and potentially higher prices driven by limited year-round inventory.”
Maine has the highest vacancy rate
Some states have vacancy rates well above the national rate of 10.1%. Maine has the country’s highest vacancy rate at 20.6%, with 154,717 vacant homes, followed by Vermont at 19.4% (65,626 homes) and Alaska at 17.6% (57,958 homes).
These states also ranked highest in our 2025 analysis of vacancy rates. The three states serve as popular vacation and recreation destinations with large concentrations of seasonal housing that remain empty for much of the year.
By contrast, Connecticut has the nation’s lowest vacancy rate at 7.0%, with 107,815 homes sitting vacant. Washington follows at 7.3% (241,800 homes). California, New Jersey and Oregon are tied for the third-lowest vacancy rate at 7.5%.
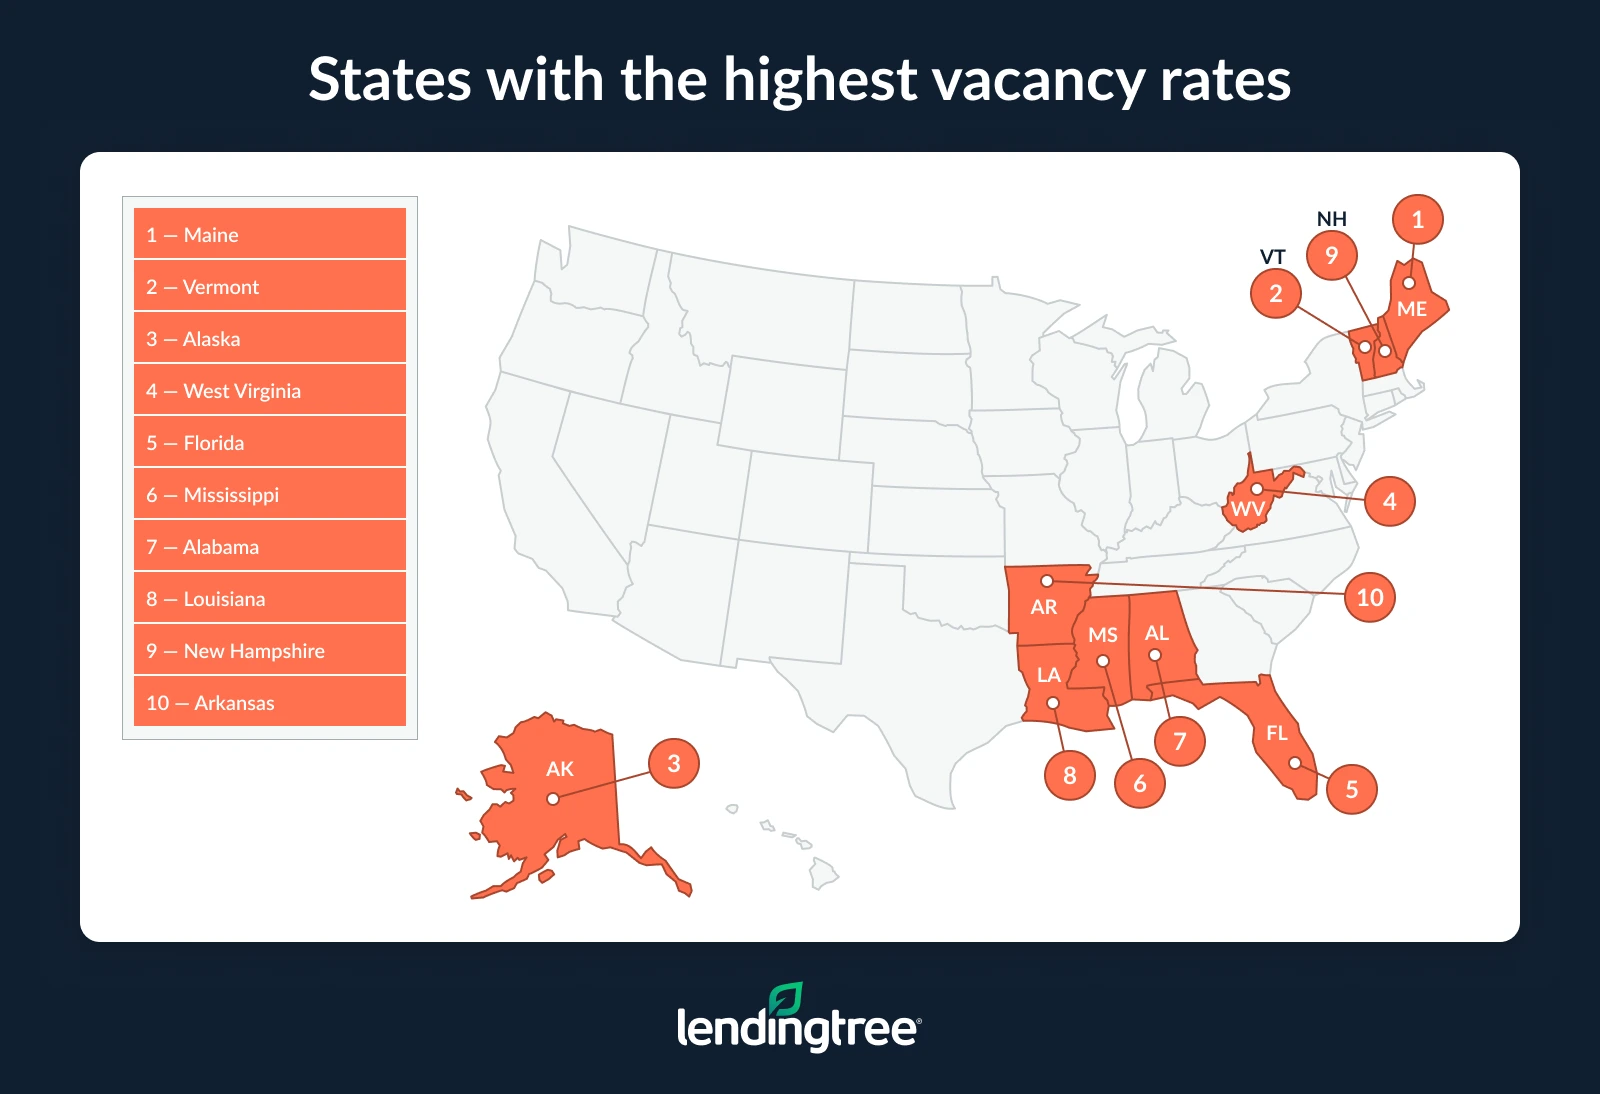
Vacancy rates and the total number of vacant homes can paint very different pictures, particularly in states with large housing inventories.
Florida is a notable example. With a vacancy rate of 14.7% — the fifth-highest in the nation — the Sunshine State is home to roughly 1.5 million vacant units. That’s nearly as many vacant homes as the other nine states in the top 10 combined.
California and Texas tell a different story. Both have about 1.1 million vacant homes, even though they rank in the bottom half of states by vacancy rate. California’s 7.5% vacancy rate is tied for the third-lowest in the nation, while Texas ranks 31st at 9.4%. In both cases, the sheer size of the housing supply drives the number of vacant homes, even when the share of vacant units is relatively low.
Full rankings: States with the highest/lowest vacancy rates
| Rank | State | Total housing units | Vacant housing units | Vacancy rate | Median home value |
|---|---|---|---|---|---|
| 1 | Maine | 751,876 | 154,717 | 20.6% | $296,600 |
| 2 | Vermont | 339,042 | 65,626 | 19.4% | $316,600 |
| 3 | Alaska | 328,491 | 57,958 | 17.6% | $352,900 |
| 4 | West Virginia | 861,325 | 132,670 | 15.4% | $162,600 |
| 5 | Florida | 10,256,470 | 1,503,660 | 14.7% | $359,000 |
| 6 | Mississippi | 1,341,114 | 195,683 | 14.6% | $169,800 |
| 7 | Alabama | 2,337,265 | 340,018 | 14.5% | $209,900 |
| 8 | Louisiana | 2,108,902 | 304,122 | 14.4% | $216,500 |
| 9 | New Hampshire | 648,472 | 92,650 | 14.3% | $402,500 |
| 10 | Arkansas | 1,394,673 | 188,686 | 13.5% | $188,000 |
| 11 | Delaware | 464,203 | 62,165 | 13.4% | $352,000 |
| 12 | Hawaii | 567,896 | 75,443 | 13.3% | $839,100 |
| 12 | South Carolina | 2,443,039 | 325,050 | 13.3% | $259,000 |
| 14 | Montana | 528,419 | 69,560 | 13.2% | $375,800 |
| 15 | New Mexico | 956,964 | 119,550 | 12.5% | $248,100 |
| 15 | North Carolina | 4,895,668 | 613,323 | 12.5% | $288,900 |
| 17 | North Dakota | 377,281 | 46,218 | 12.3% | $249,900 |
| 18 | Wyoming | 277,141 | 33,823 | 12.2% | $309,700 |
| 19 | Oklahoma | 1,775,127 | 212,738 | 12.0% | $199,800 |
| 20 | Michigan | 4,622,236 | 545,867 | 11.8% | $231,600 |
| 21 | Missouri | 2,825,287 | 317,060 | 11.2% | $230,300 |
| 22 | Wisconsin | 2,778,572 | 299,092 | 10.8% | $266,500 |
| 23 | Arizona | 3,192,839 | 336,758 | 10.5% | $394,500 |
| 23 | South Dakota | 408,584 | 43,040 | 10.5% | $257,400 |
| 25 | Georgia | 4,541,835 | 467,469 | 10.3% | $303,300 |
| 25 | Idaho | 795,014 | 82,009 | 10.3% | $418,600 |
| 25 | Kentucky | 2,023,116 | 208,647 | 10.3% | $205,600 |
| 28 | Tennessee | 3,143,670 | 319,393 | 10.2% | $286,700 |
| 29 | District of Columbia | 361,014 | 36,523 | 10.1% | $737,100 |
| 30 | New York | 8,585,241 | 862,595 | 10.0% | $423,800 |
| 31 | Texas | 12,128,515 | 1,135,699 | 9.4% | $283,800 |
| 32 | Minnesota | 2,545,030 | 237,075 | 9.3% | $329,300 |
| 32 | Nevada | 1,326,471 | 123,878 | 9.3% | $435,400 |
| 34 | Kansas | 1,293,635 | 119,575 | 9.2% | $217,200 |
| 34 | Pennsylvania | 5,806,452 | 531,599 | 9.2% | $254,500 |
| 36 | Rhode Island | 485,932 | 44,362 | 9.1% | $404,200 |
| 37 | Indiana | 2,976,568 | 260,559 | 8.8% | $218,200 |
| 38 | Virginia | 3,684,756 | 319,024 | 8.7% | $383,700 |
| 39 | Iowa | 1,437,699 | 121,992 | 8.5% | $208,000 |
| 40 | Colorado | 2,589,053 | 214,835 | 8.3% | $539,400 |
| 41 | Massachusetts | 3,030,406 | 245,364 | 8.1% | $562,100 |
| 41 | Ohio | 5,292,391 | 429,200 | 8.1% | $214,800 |
| 41 | Utah | 1,223,468 | 98,646 | 8.1% | $489,400 |
| 44 | Illinois | 5,457,452 | 421,003 | 7.7% | $263,300 |
| 44 | Maryland | 2,560,784 | 197,856 | 7.7% | $419,900 |
| 46 | Nebraska | 863,444 | 65,597 | 7.6% | $238,600 |
| 47 | California | 14,644,735 | 1,096,644 | 7.5% | $734,700 |
| 47 | New Jersey | 3,791,354 | 283,653 | 7.5% | $454,400 |
| 47 | Oregon | 1,857,992 | 139,570 | 7.5% | $477,600 |
| 50 | Washington | 3,306,620 | 241,800 | 7.3% | $564,600 |
| 51 | Connecticut | 1,541,822 | 107,815 | 7.0% | $366,900 |
National vacancy rates are shrinking
The share of vacant homes nationwide declined between 2023 and 2024, falling by 0.31 percentage points from 10.4% to 10.1%. (Vacancy rates are rounded to one decimal for consistency, but we show the change with two decimals to differentiate.) That translates to roughly 302,000 fewer vacant homes across the country.
Vacancy rates have generally moved downward over the past decade, falling from 12.5% in 2014 to 10.1% in 2024, as housing supply has struggled to keep pace with demand. More recently, elevated mortgage rates and high home prices have limited housing turnover, keeping inventory low.
“Falling vacancy rates often signal a tightening housing market, where available homes are being absorbed faster than new inventory is coming online,” Schulz says. “For buyers and renters, that can translate into more competition, fewer choices and less negotiating power.
“In many cases, lower vacancy rates also drive both home prices and rents higher. While every market is different, declining vacancies are often a sign that housing demand remains strong relative to supply.”
Several states saw above-average declines in vacancy rates over the past year. Wyoming recorded the largest drop, with its vacancy rate falling by 1.23 percentage points. North Dakota followed with a 1.03-point decline, while Rhode Island’s vacancy rate fell by 0.72 points.
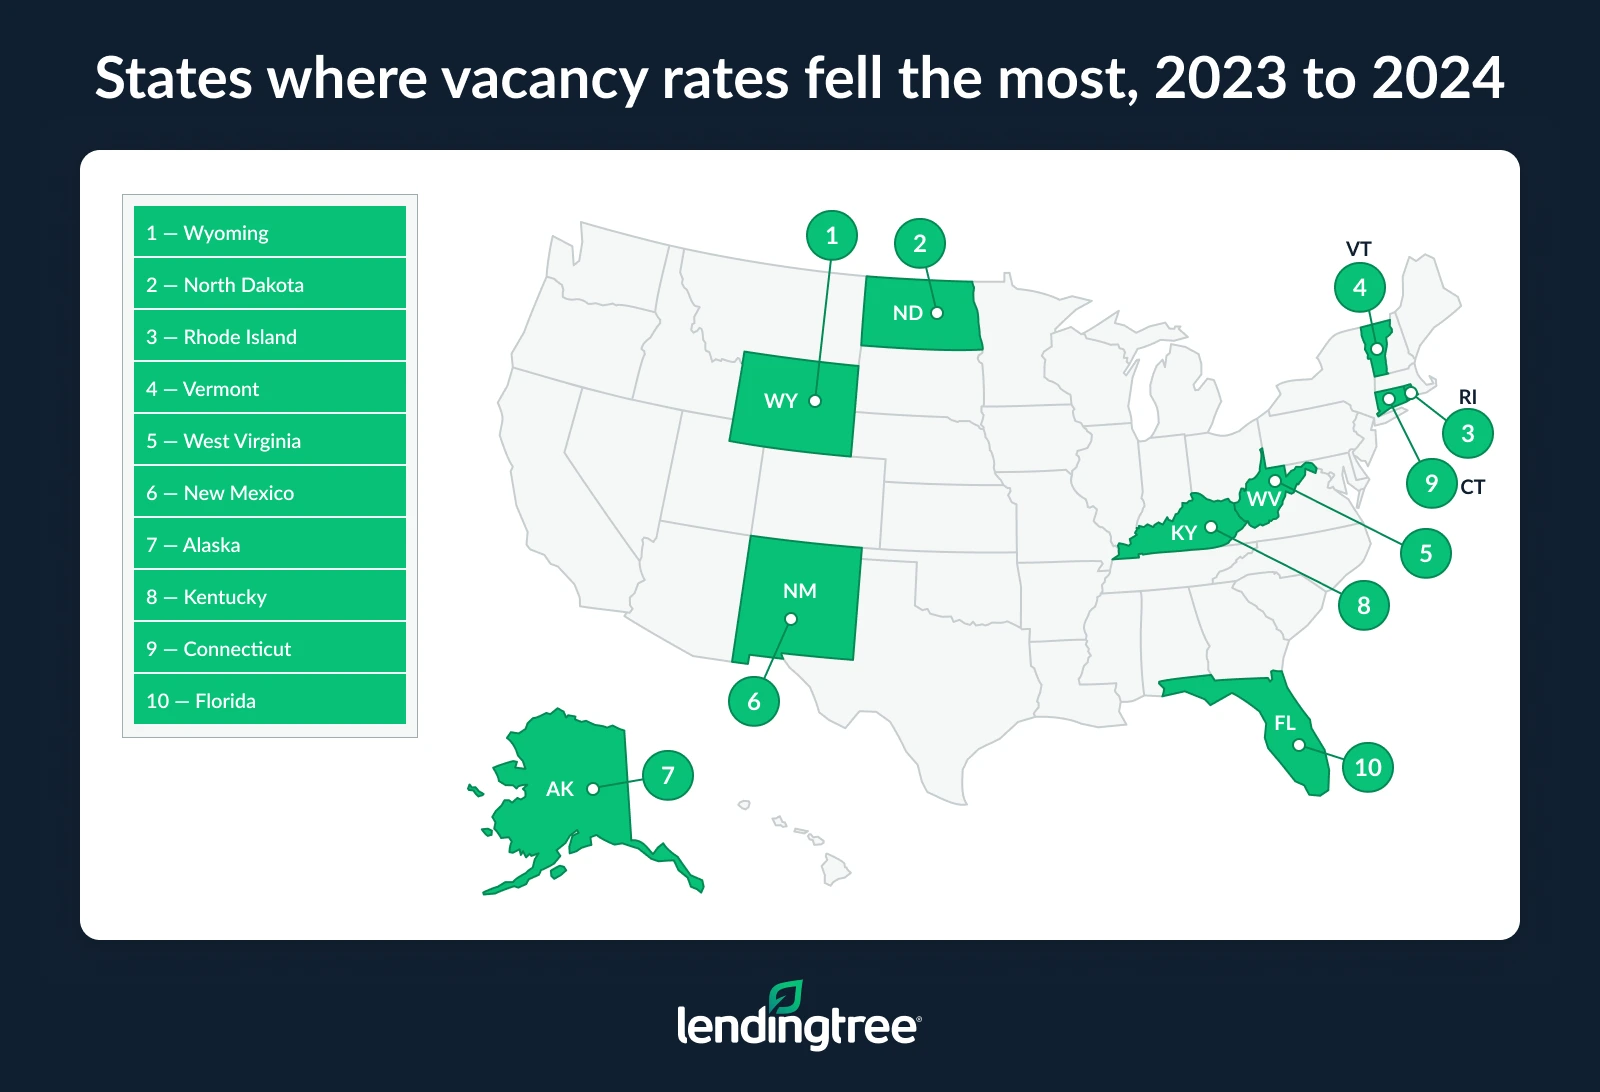
In contrast, vacancy rates increased in just two places. The District of Columbia saw the largest increase, rising 0.42 percentage points, while Oregon’s vacancy rate edged up by 0.05 points.
Full rankings: States with the biggest increases/decreases in vacancy rates
| Rank | State | Vacancy rate, 2023 | Vacancy rate, 2024 | % point change |
|---|---|---|---|---|
| 1 | District of Columbia | 9.7% | 10.1% | 0.42 |
| 2 | Oregon | 7.5% | 7.5% | 0.05 |
| 3 | California | 7.6% | 7.5% | -0.06 |
| 4 | Minnesota | 9.4% | 9.3% | -0.07 |
| 5 | Delaware | 13.5% | 13.4% | -0.09 |
| 6 | Washington | 7.4% | 7.3% | -0.11 |
| 7 | Nevada | 9.5% | 9.3% | -0.14 |
| 7 | New York | 10.2% | 10.1% | -0.14 |
| 9 | Hawaii | 13.4% | 13.3% | -0.16 |
| 9 | New Hampshire | 14.5% | 14.3% | -0.16 |
| 9 | Iowa | 8.7% | 8.5% | -0.16 |
| 12 | Utah | 8.2% | 8.1% | -0.17 |
| 13 | Texas | 9.6% | 9.4% | -0.26 |
| 13 | Pennsylvania | 9.4% | 9.2% | -0.26 |
| 15 | Montana | 13.4% | 13.2% | -0.27 |
| 15 | Ohio | 8.4% | 8.1% | -0.27 |
| 17 | Massachusetts | 8.4% | 8.1% | -0.28 |
| 18 | Wisconsin | 11.1% | 10.8% | -0.32 |
| 18 | Georgia | 10.6% | 10.3% | -0.32 |
| 20 | Virginia | 9.0% | 8.7% | -0.33 |
| 20 | Colorado | 8.6% | 8.3% | -0.33 |
| 22 | Missouri | 11.6% | 11.2% | -0.34 |
| 23 | Michigan | 12.2% | 11.8% | -0.35 |
| 23 | Idaho | 10.7% | 10.3% | -0.35 |
| 25 | South Dakota | 10.9% | 10.5% | -0.36 |
| 25 | Maryland | 8.1% | 7.7% | -0.36 |
| 27 | Illinois | 8.1% | 7.7% | -0.40 |
| 27 | New Jersey | 7.9% | 7.5% | -0.40 |
| 27 | Tennessee | 10.6% | 10.2% | -0.40 |
| 30 | Louisiana | 14.8% | 14.4% | -0.42 |
| 31 | Nebraska | 8.0% | 7.6% | -0.43 |
| 32 | Alabama | 15.0% | 14.6% | -0.44 |
| 33 | Indiana | 9.2% | 8.8% | -0.45 |
| 33 | Kansas | 9.7% | 9.2% | -0.45 |
| 33 | Arizona | 11.0% | 10.6% | -0.45 |
| 36 | Arkansas | 14.0% | 13.5% | -0.47 |
| 37 | South Carolina | 13.8% | 13.3% | -0.48 |
| 38 | Mississippi | 15.1% | 14.6% | -0.49 |
| 39 | Oklahoma | 12.5% | 12.0% | -0.51 |
| 39 | Maine | 21.1% | 20.6% | -0.51 |
| 41 | North Carolina | 13.1% | 12.5% | -0.52 |
| 42 | Florida | 15.2% | 14.7% | -0.53 |
| 43 | Connecticut | 7.5% | 7.0% | -0.55 |
| 44 | Kentucky | 10.9% | 10.3% | -0.57 |
| 45 | Alaska | 18.2% | 17.6% | -0.60 |
| 46 | New Mexico | 13.1% | 12.5% | -0.62 |
| 47 | West Virginia | 16.1% | 15.4% | -0.68 |
| 48 | Vermont | 20.1% | 19.4% | -0.70 |
| 49 | Rhode Island | 9.9% | 9.1% | -0.72 |
| 50 | North Dakota | 13.3% | 12.3% | -1.03 |
| 51 | Wyoming | 13.4% | 12.2% | -1.23 |
Lower vacancy rates come with a higher price tag
States with lower vacancy rates generally have higher home values. Comparing the states with the highest and lowest vacancy rates reveals a clear relationship. The 11 states (because of a tie) with the lowest vacancy rates have an average median home value of $435,118. That’s $167,678 higher than the average median home value of $267,440 in the 10 states with the highest vacancy rates.
“When fewer homes are sitting vacant, housing is generally scarcer, which tends to support higher home values,” Schulz says. “On the flip side, markets with more vacant housing often have less competition for homes and, in many cases, lower prices.”
Of course, the relationship isn’t always straightforward. Several states rank among the nation’s highest-vacancy states while having home values above the national median of $332,700.
Alaska, Florida and New Hampshire are notable examples. All three rank among the highest-vacancy states while maintaining home values above the national median.
“The outliers tell us that vacancies aren’t the only factor at play here,” Schulz says. “In Florida, for example, there are likely to be lots of seasonal vacancies, since so many people have second homes there. That demand for retirement homes or vacation properties keeps values higher despite those seasonal vacancies.”
4 tips for buyers and renters navigating a tight housing market
While vacancy rates have declined nationwide, that doesn’t mean finding a home is impossible. Whether you’re looking to buy or rent, a little preparation and flexibility can help you compete in a market where available housing remains limited.
- Be prepared. “Buyers should get preapproved before they start house hunting, and renters should have application materials ready to submit,” Schulz says. “In competitive markets, the people who are organized and ready to act often have an advantage over those who are still getting their paperwork together.”
- Know your budget. Before touring homes or signing a lease, understand what you can comfortably afford. Review your income, monthly expenses and savings, and estimate your monthly payment with a mortgage calculator so you can focus your search on realistic options and avoid financial stress later.
- Be flexible. “Expanding your search area, adjusting your timeline or compromising on certain features can dramatically increase your options,” Schulz says. Shopping around for lenders can move the needle, too, saving borrowers more than $60,000 on average. “The more flexible you can be, the more likely you are to find something that fits both your needs and your budget.”
- Move quickly, but don’t rush. In competitive markets, desirable homes can attract attention fast, so be prepared to act when you find a good fit. “Tight markets can make it feel like you need to jump at every opportunity, but that’s not always the case,” Schulz says. “It’s important to move quickly when the right home or apartment comes along, but not so quickly that you make a financial decision you’ll regret later.”
Methodology
LendingTree researchers analyzed data from the U.S. Census Bureau 2024 American Community Survey (ACS) with five-year estimates. The vacancy rate is calculated by dividing the number of vacant housing units by the total number of housing units.
The Census Bureau classifies vacant homes into seven subcategories:
- For rent: These are vacant units offered “for rent,” or vacant units that are offered for either sale or rent.
- Rented, not occupied: These are vacant units where a rental agreement has been reached but the future occupants haven’t moved in yet.
- For sale only: These are vacant units currently on the market.
- Sold, not occupied: Similar to “rented, not occupied,” this category covers homes that have sold but the new owner hasn’t moved in yet.
- For seasonal, recreational or occasional use: These include homes for seasonal use like beach cottages and hunting cabins or lodging for seasonal workers like herders and loggers. Timeshare condominiums are also included in this category.
- For migrant workers: These are homes for migrant workers to occupy while they’re employed in farmwork during the crop season.
- Other vacant: This category captures vacant homes that don’t fall into any of the above categories.
We also analyzed the U.S. Census Bureau 2023 ACS with five-year estimates to compare vacancy rates between 2023 and 2024.
View mortgage loan offers from up to 5 lenders in minutes