Best and Worst Drivers by Brand: 2026 Report


Many drivers have a favorite car brand or one they hate seeing on the road. Their distrust may be warranted, whether they’ve had bad experiences with other drivers or they buy into another brand’s reputation.
We utilized QuoteWizard by LendingTree insurance quote data to determine which car brands have the worst drivers. Here’s what we found.
Key findings
- BMW, Ram and Tesla have the worst drivers. Nationally, BMW drivers had 44.9 incidents (accidents, DUIs, speeding and citations) per 1,000 drivers from Jan. 1 through Dec. 16, 2025 — the highest among major brands. Ram (44.7) ranks second, while Tesla (42.8) falls to third after leading last year.
- Chrysler, Cadillac and Mercury have the best drivers. Chrysler drivers had 25.5 incidents per 1,000 drivers nationally — the lowest rate among the major brands. Cadillac (27.0) and Mercury (27.9) follow.
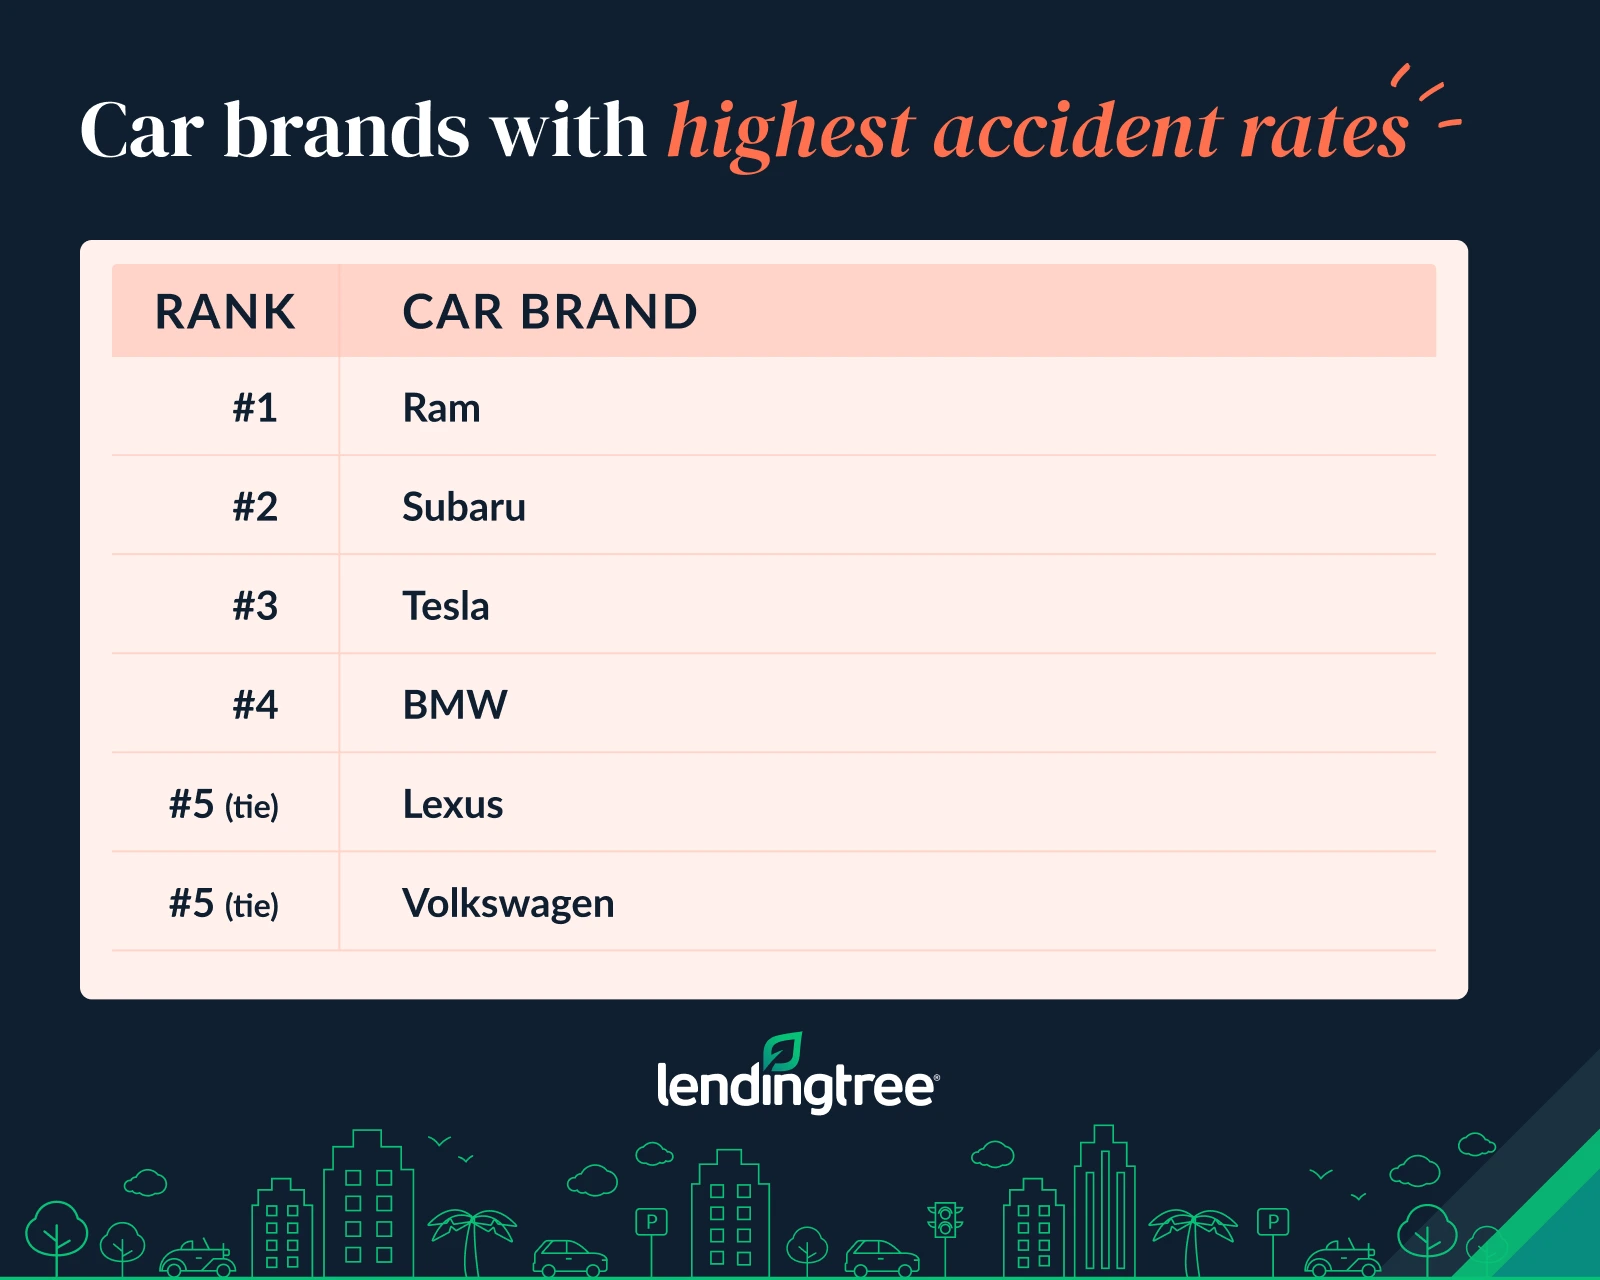
- Some of the brands with the poorest driving records are among the accident leaders. Ram (23.9) and Tesla (23.1) finish in the top three again when it comes to the highest numbers of accidents, with Subaru joining in the middle at 23.2 accidents per 1,000 drivers. At the other end, Mercury (12.7), Chrysler (12.9) and Pontiac (13.3) had the lowest accident rates.
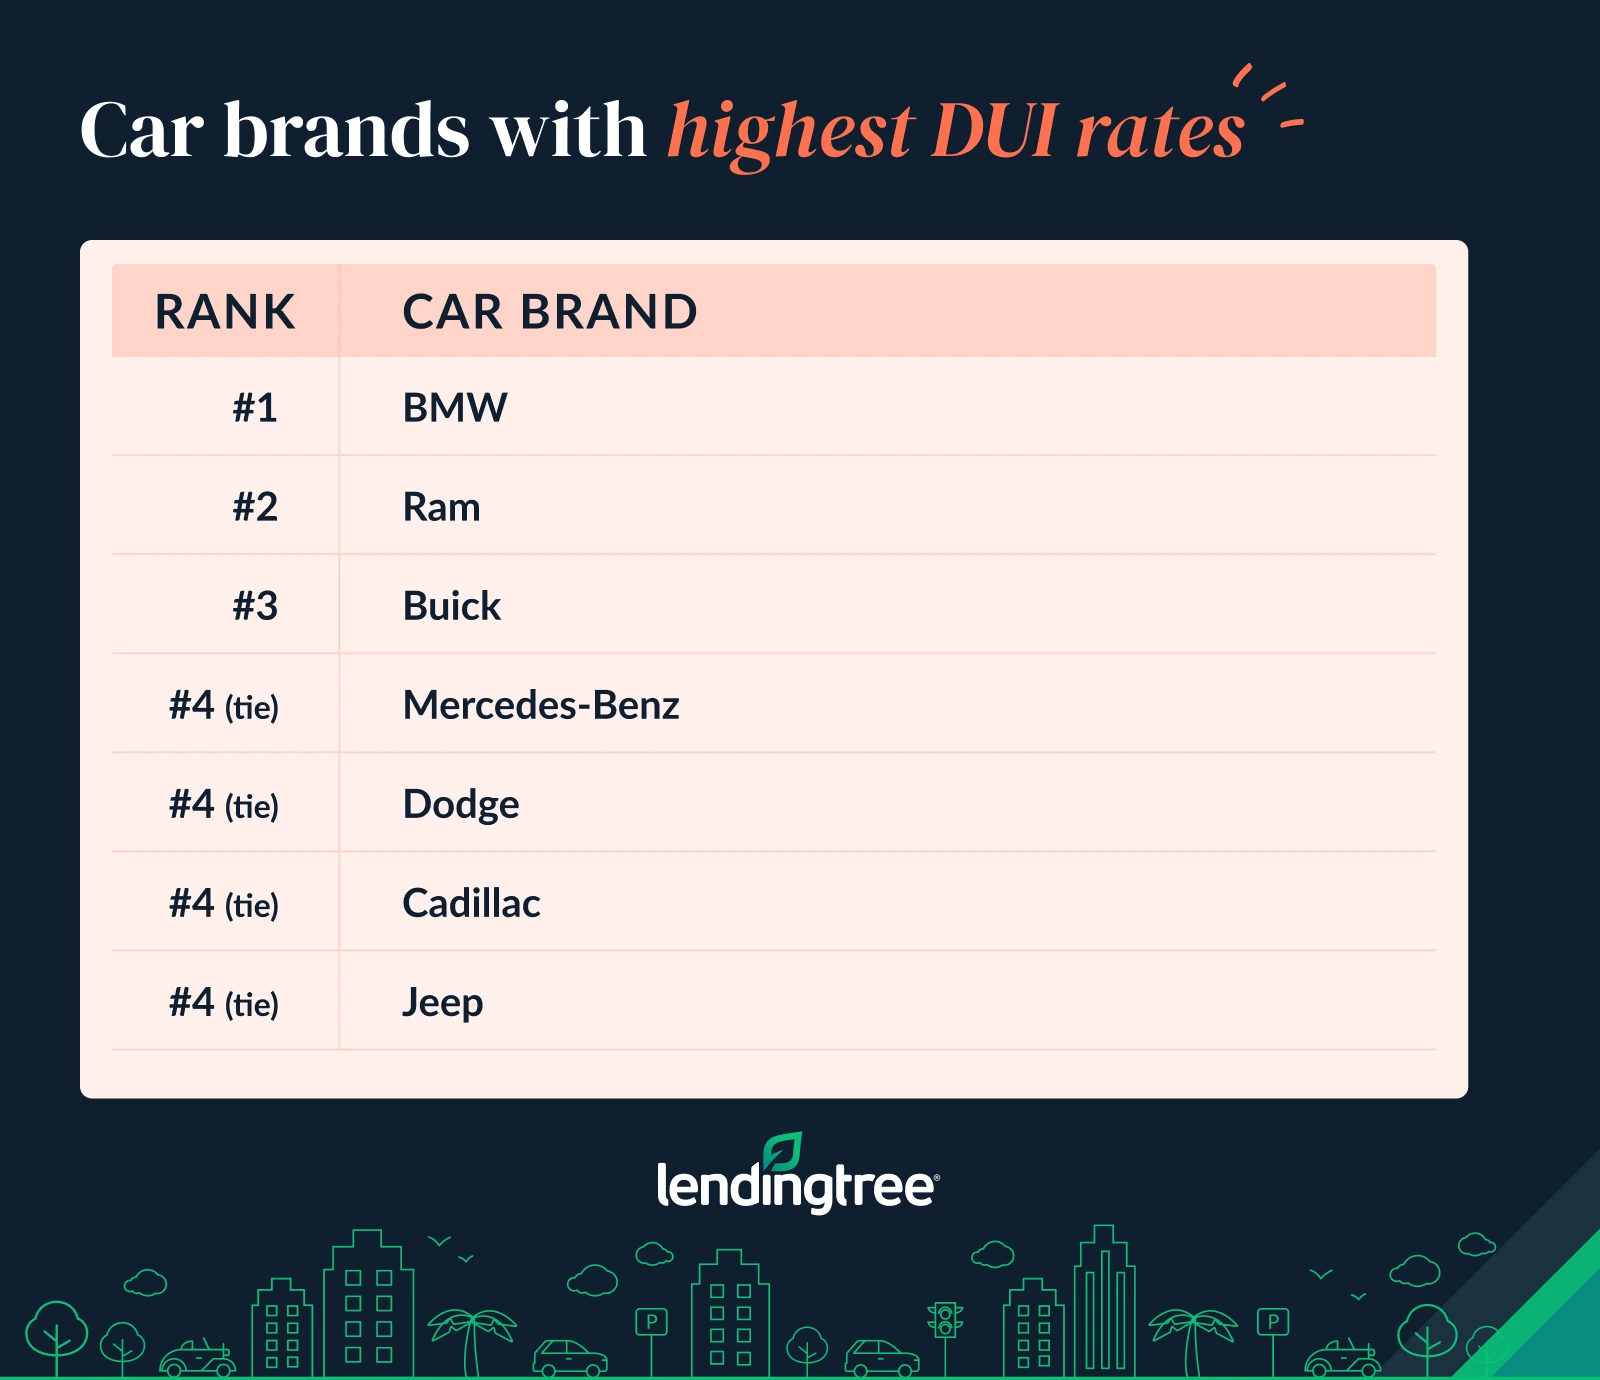
- BMW drivers have far higher DUI rates than those of other brands. BMW tops the list with 4.8 DUIs per 1,000 drivers — more than double the rate of second-place Ram (2.2). Buick (1.7) ranks third.
BMW has worst drivers
This year, BMW drivers are the worst on the road.
From Jan. 1 through Dec. 16, 2025, BMW drivers had 44.9 incidents per 1,000 drivers nationally. That includes accidents, DUIs, speeding and citations.
Ram ranks second, with 44.7 incidents per 1,000 drivers.
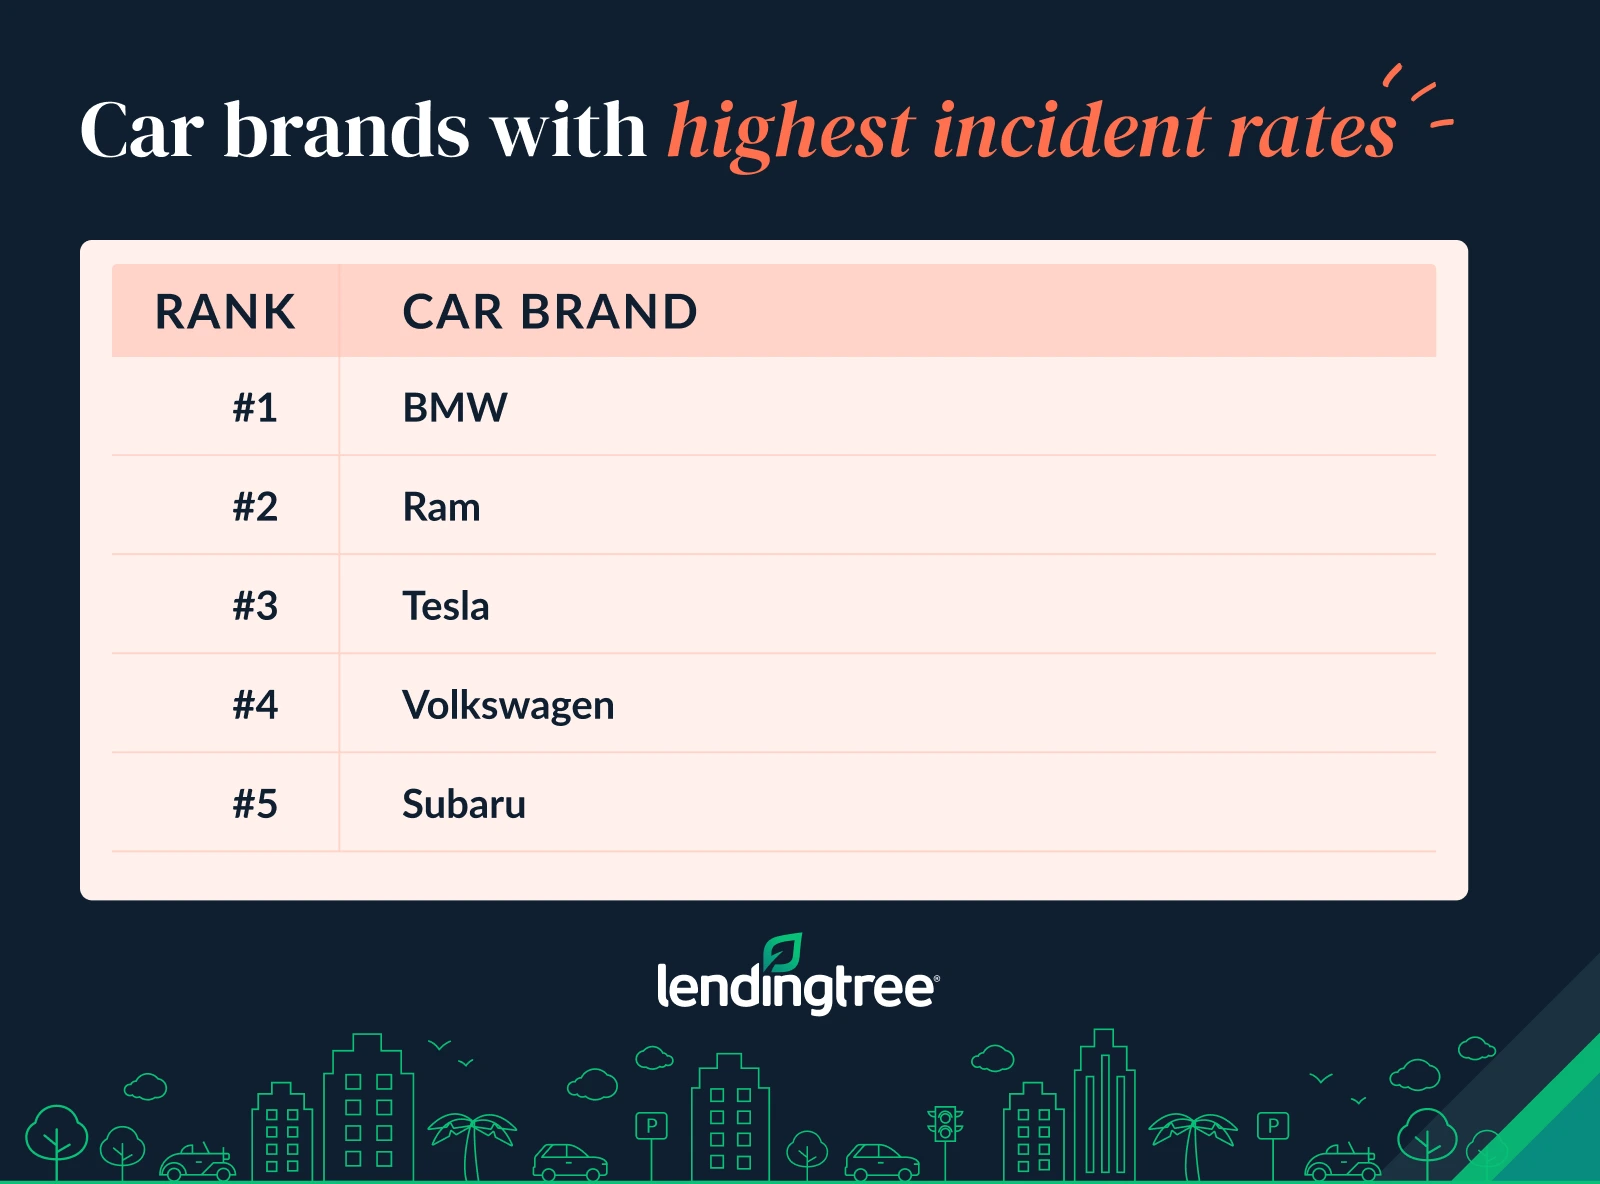
Tesla ranks third, at 42.8. In last year’s version, Tesla ranked first.
LendingTree car insurance expert and licensed insurance agent Rob Bhatt attributes the high incident rates to the models these brands have available.
“BMW and Tesla drivers have many high-performance vehicles, which can tempt their owners to drive too fast or take other chances on the road,” he says. “Meanwhile, Ram trucks seem to attract young males, who tend to have a greater appetite for risk than other groups. Unfortunately, an appetite for risk when you’re driving can lead to a citation or worse.”
Notably, BMW sells several sports cars, such as the M line, which is known for high speeds.
Chrysler has best drivers
At the other end of the list, Chrysler drivers are the best across the brands analyzed, with just 25.5 incidents per 1,000 drivers nationally.
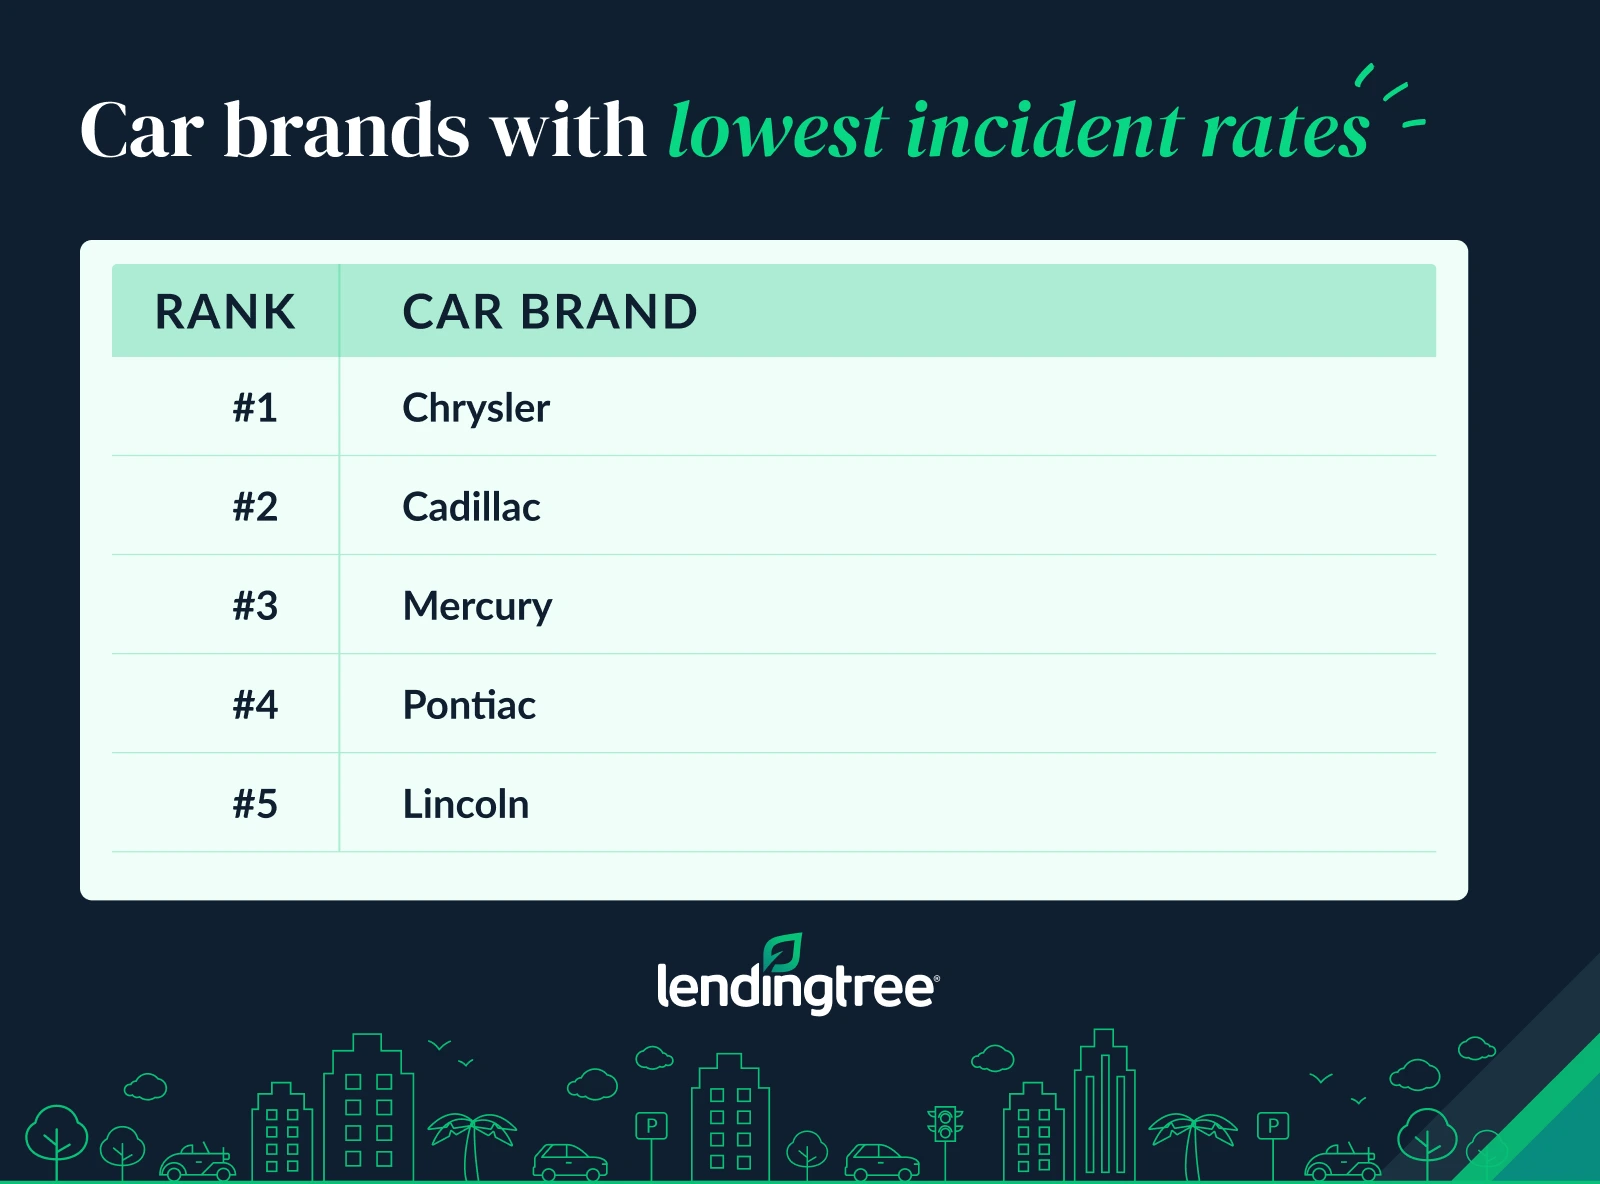
Cadillac ranked next, with 27.0 incidents. Mercury (27.9) ranked third.
While always a good thing, having a reputation for responsible drivers doesn’t necessarily help when it comes to car insurance rates.
“Insurance companies look at factors like a car’s claims frequency and severity to determine how expensive it is to insure,” Bhatt says. “Cars involved in a high rate of accidents have a greater claims frequency. Cars that get into accidents with high medical and car repair costs have greater claims severity. A car with low claims frequency may still cost more to insure if it has high claims severity, which can happen for cars that are expensive to repair or replace.”
For example, luxury cars like Cadillacs are expensive to repair or replace. That’s why Cadillacs usually cost more to insure than economy cars. That said, a Cadillac is usually going to cost less to insure when compared to a comparable luxury vehicle with a higher claims frequency.
Full rankings: Car brands with highest/lowest incident rates
| Rank | Brand | Driving incidents per 1,000 drivers |
|---|---|---|
| 1 | BMW | 44.9 |
| 2 | Ram | 44.7 |
| 3 | Tesla | 42.8 |
| 4 | Volkswagen | 40.6 |
| 5 | Subaru | 40.3 |
| 6 | Infiniti | 40.0 |
| 7 | Audi | 38.7 |
| 8 | Mazda | 37.8 |
| 9 | Honda | 37.0 |
| 10 | Toyota | 36.7 |
| 11 | Acura | 36.5 |
| 12 | Jeep | 36.1 |
| 13 | Hyundai | 35.8 |
| 13 | Kia | 35.8 |
| 13 | Lexus | 35.8 |
| 16 | Nissan | 34.8 |
| 17 | Mercedes-Benz | 34.6 |
| 18 | Mitsubishi | 34.3 |
| 19 | Ford | 33.6 |
| 20 | Chevrolet | 33.3 |
| 21 | Land Rover | 33.2 |
| 22 | GMC | 33.1 |
| 23 | Volvo | 31.9 |
| 24 | Dodge | 31.3 |
| 25 | Buick | 30.9 |
| 26 | Lincoln | 30.3 |
| 27 | Pontiac | 29.1 |
| 28 | Mercury | 27.9 |
| 29 | Cadillac | 27.0 |
| 30 | Chrysler | 25.5 |
Brands with worst drivers have high accident rates
Perhaps unsurprisingly, the brands with the worst drivers have some of the highest accident rates. Ram ranks first in this metric, with 23.9 accidents per 1,000 drivers. Subaru (23.2) ranks second, followed by Tesla (23.1) and BMW (22.9).
Meanwhile, the brands with the best drivers have some of the lowest accident rates. Mercury (12.7) ranks first for the lowest number of accidents per 1,000 drivers, with Chrysler (12.9) and Pontiac (13.3) ranking second and third, respectively.
When it comes to rates of speeding, however, there’s not as much variation across brands. Infiniti leads with 3.3 speeding incidents per 1,000 drivers, but four brands — Volkswagen, Mercury, Ram and Tesla — follow closely at 3.2. Overall, differences in rates of speeding between brands are minimal, with every other brand among the 30 analyzed falling between 2.0 and 3.0 incidents per 1,000 drivers.
“Accidents have a greater impact on insurance pricing for vehicles than violations,” Bhatt says. “Accidents cost insurance companies money, in the form of payments for medical treatment and car repairs. Speeding and other violations impact rates for an individual driver, but not necessarily their vehicle type. Insurance companies view drivers with tickets or accidents on their record as risky to insure, regardless of the type of vehicle they drive.”
Full rankings: Car brands with highest accident rates
| Rank | Brand | Accidents per 1,000 drivers |
|---|---|---|
| 1 | Ram | 23.9 |
| 2 | Subaru | 23.2 |
| 3 | Tesla | 23.1 |
| 4 | BMW | 22.9 |
| 5 | Lexus | 20.8 |
| 5 | Volkswagen | 20.8 |
| 7 | Mazda | 20.6 |
| 8 | Infiniti | 20.5 |
| 9 | Toyota | 20.3 |
| 10 | Honda | 19.6 |
| 10 | Audi | 19.6 |
| 12 | Acura | 19.1 |
| 13 | Jeep | 19.0 |
| 14 | Hyundai | 18.9 |
| 15 | Kia | 18.7 |
| 16 | Nissan | 18.3 |
| 16 | Mercedes-Benz | 18.3 |
| 18 | Mitsubishi | 18.2 |
| 19 | Volvo | 18.0 |
| 20 | GMC | 17.3 |
| 21 | Ford | 17.2 |
| 22 | Land Rover | 16.9 |
| 23 | Chevrolet | 16.8 |
| 23 | Buick | 16.8 |
| 25 | Lincoln | 16.5 |
| 26 | Cadillac | 14.2 |
| 27 | Dodge | 14.0 |
| 28 | Pontiac | 13.3 |
| 29 | Chrysler | 12.9 |
| 30 | Mercury | 12.7 |
Full rankings: Car brands with highest speeding rates
| Rank | Brand | Speeding-related incidents per 1,000 drivers |
|---|---|---|
| 1 | Infiniti | 3.3 |
| 2 | Volkswagen | 3.2 |
| 2 | Mercury | 3.2 |
| 2 | Ram | 3.2 |
| 2 | Tesla | 3.2 |
| 6 | Dodge | 2.9 |
| 6 | Hyundai | 2.9 |
| 8 | Kia | 2.8 |
| 9 | Mitsubishi | 2.7 |
| 9 | Mercedes-Benz | 2.7 |
| 9 | Lincoln | 2.7 |
| 9 | Ford | 2.7 |
| 13 | Nissan | 2.6 |
| 13 | Chevrolet | 2.6 |
| 13 | Acura | 2.6 |
| 16 | Toyota | 2.5 |
| 16 | Pontiac | 2.5 |
| 16 | Honda | 2.5 |
| 16 | Subaru | 2.5 |
| 16 | GMC | 2.5 |
| 16 | Jeep | 2.5 |
| 16 | BMW | 2.5 |
| 16 | Land Rover | 2.5 |
| 24 | Audi | 2.4 |
| 25 | Buick | 2.3 |
| 25 | Mazda | 2.3 |
| 25 | Volvo | 2.3 |
| 28 | Chrysler | 2.1 |
| 29 | Cadillac | 2.0 |
| 29 | Lexus | 2.0 |
BMW drivers have highest DUI rates
When it comes to DUIs, BMW drivers rank first by far, with 4.8 DUIs per 1,000 drivers. Notably, this is more than double the rate of the next highest brand, Ram, at 2.2 DUIs per 1,000 drivers. Buick (1.7) ranks third.
That’s significant, Bhatt says.
“A DUI raises the average price of car insurance by 86%,” he says. “For comparison, a speeding ticket only raises rates by an average of 24%. An accident raises rates by about 50%. There are usually also fewer additional costs associated with a speeding ticket than a DUI. For example, you rarely need to hire a lawyer to defend you after a speeding ticket.”
Meanwhile, Chrysler and Volvo are the only two brands with DUI rates below 1.0, both at 0.9. Meanwhile, Lexus, Mazda and Nissan tie for next-lowest, each at 1.0 DUIs per 1,000 drivers.
Full rankings: Car brands with highest DUI rates
| Rank | Brand | DUIs per 1,000 drivers |
|---|---|---|
| 1 | BMW | 4.8 |
| 2 | Ram | 2.2 |
| 3 | Buick | 1.7 |
| 4 | Mercedes-Benz | 1.6 |
| 4 | Dodge | 1.6 |
| 4 | Cadillac | 1.6 |
| 4 | Jeep | 1.6 |
| 8 | Tesla | 1.5 |
| 8 | Lincoln | 1.5 |
| 10 | Chevrolet | 1.4 |
| 10 | Audi | 1.4 |
| 10 | Ford | 1.4 |
| 10 | Volkswagen | 1.4 |
| 10 | GMC | 1.4 |
| 15 | Infiniti | 1.3 |
| 15 | Mercury | 1.3 |
| 15 | Subaru | 1.3 |
| 15 | Honda | 1.3 |
| 19 | Acura | 1.2 |
| 19 | Kia | 1.2 |
| 19 | Mitsubishi | 1.2 |
| 22 | Pontiac | 1.1 |
| 22 | Hyundai | 1.1 |
| 22 | Toyota | 1.1 |
| 22 | Land Rover | 1.1 |
| 26 | Nissan | 1.0 |
| 26 | Mazda | 1.0 |
| 26 | Lexus | 1.0 |
| 29 | Volvo | 0.9 |
| 29 | Chrysler | 0.9 |
Keeping premiums affordable: Top expert tips
Whether you’re a good driver or you drive a car with a bad reputation, it’s important to make sure you’re adequately insured. Bhatt recommends the following:
- Shop around. Each insurance company uses a different system to calculate rates. Some companies place greater emphasis on the car you drive than others. To ensure you’re getting the most competitive rate you can, it pays to shop around.
- Consider uninsured motorist coverage. No matter how much insurance coverage you purchase, you can’t guarantee that other drivers are equally insured, which can be a massive pain if you’re involved in an accident with them. Uninsured motorist coverage can help cover costs like medical expenses or car damage.
- Pay attention to the road, and drive responsibly. Excessive speed, impairment and distracted driving are among the most common factors in accidents, Bhatt says. “Just avoiding these three things can help you avoid accidents and other incidents. In the process, it also helps you get or keep low insurance rates. The insurance rate you get for a car with a bad reputation will always be lower when you keep your driving reputation, or your driving record, intact.”
Methodology
Researchers analyzed tens of millions of QuoteWizard by LendingTree auto insurance inquiries from Jan. 1, 2025, through Dec. 16, 2025.
To determine the best and worst drivers by vehicle brand, researchers calculated the number of driving incidents per 1,000 drivers associated with each make. This included accidents, DUIs, speeding-related incidents and general citations. We evaluated the 30 car makes with the highest numbers of inquiries.
We also evaluated accidents, DUIs and speeding-related incidents individually, and the top five worst-driving brands in 2023, 2024 and 2025.
The categories that fell under general citations included:
- Carelessness or recklessness
- Improper lane usage, improper passing and improper turning
- No insurance or no license to operate a vehicle, or misrepresenting a license
- Failure to yield to a car or pedestrian
- Safety violations, following another vehicle closely and passing a bus
- Not signaling
- Hit-and-runs involving a bicycle or pedestrian
- Having defective equipment or using the wrong road
- Other or miscellaneous citations