Texting While Driving Drives Motorists Mad — 2024 Driving Pet Peeves Report
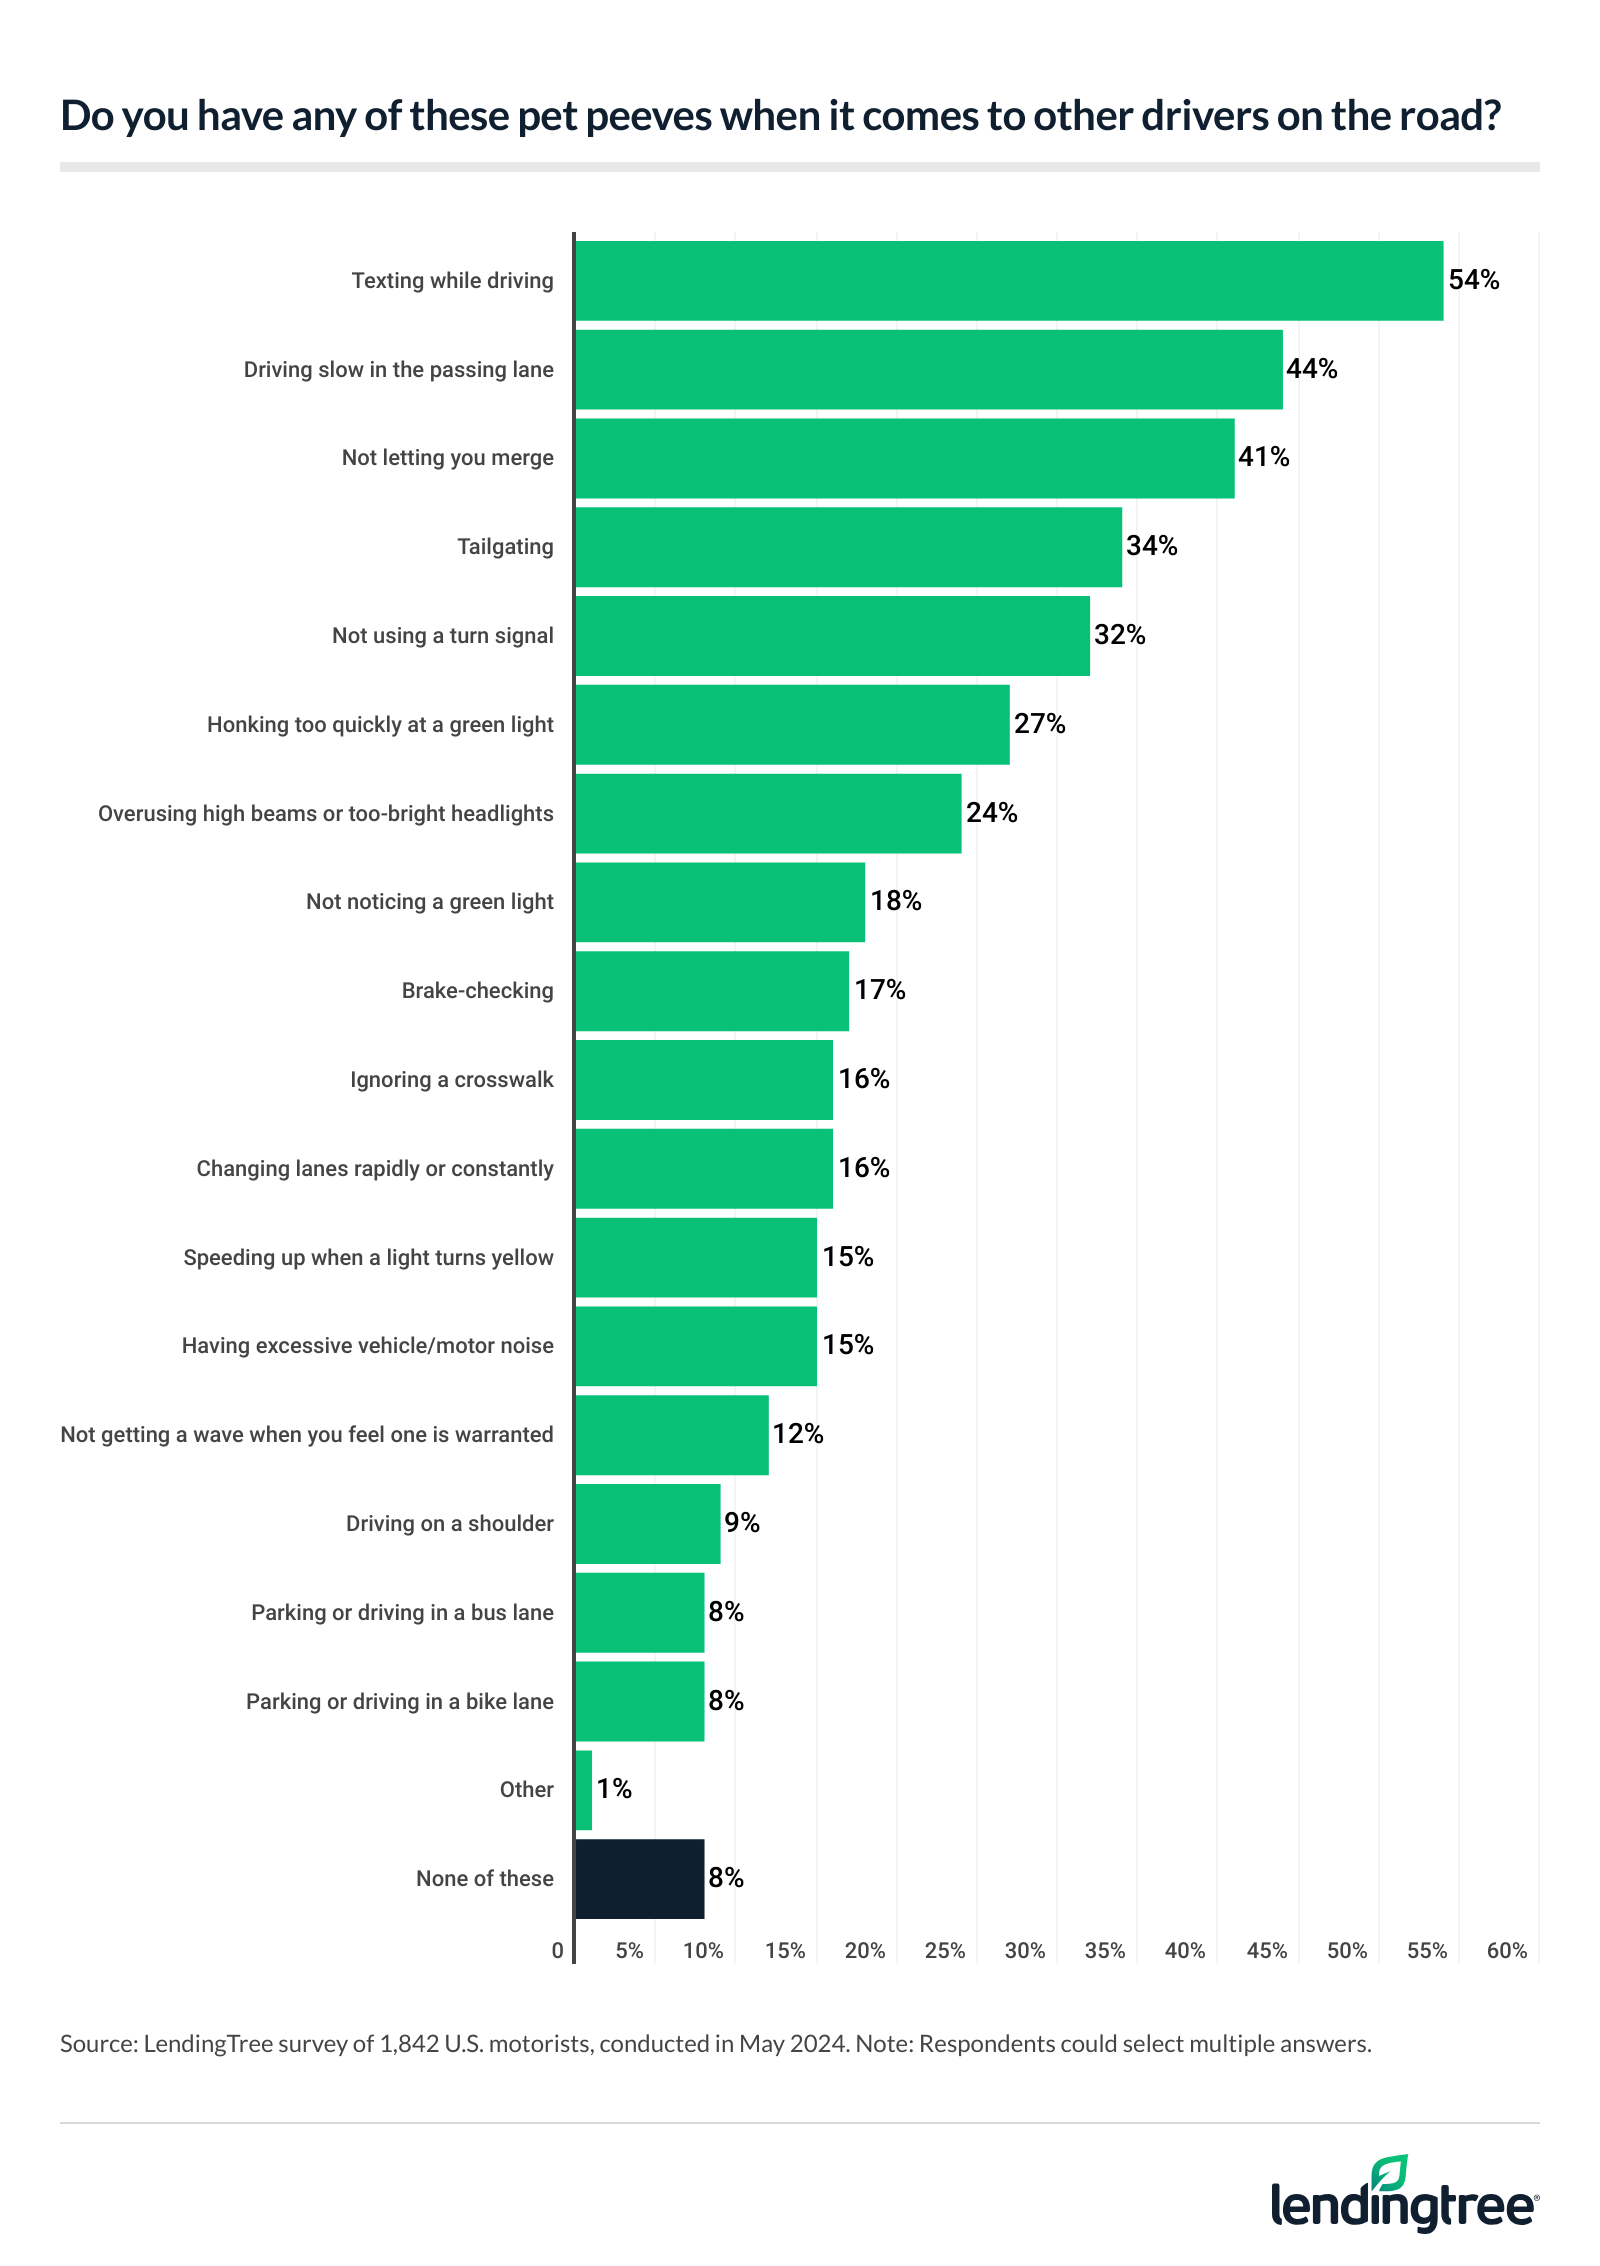
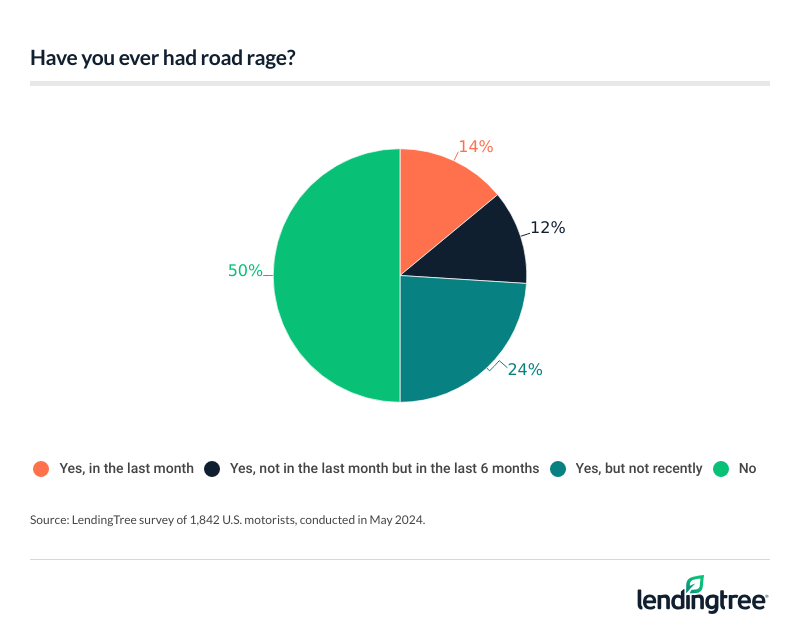
Driving can be frustrating, and tempers may be shorter than they would be otherwise. In fact, 92% of drivers have a driving pet peeve, according to the latest LendingTree survey of over 2,000 U.S. consumers — and 50% of motorists say they’ve had road rage.
Here’s what else we found.
Key findings
- Almost all drivers have at least one pet peeve caused by fellow motorists. Among the 92% of drivers with a pet peeve, texting while driving tops the list (54%). That’s followed by drivers going slow in the passing lane (44%) and those that don’t let you merge (41%). As for speed, 50% of motorists say slow drivers are more annoying than fast ones.
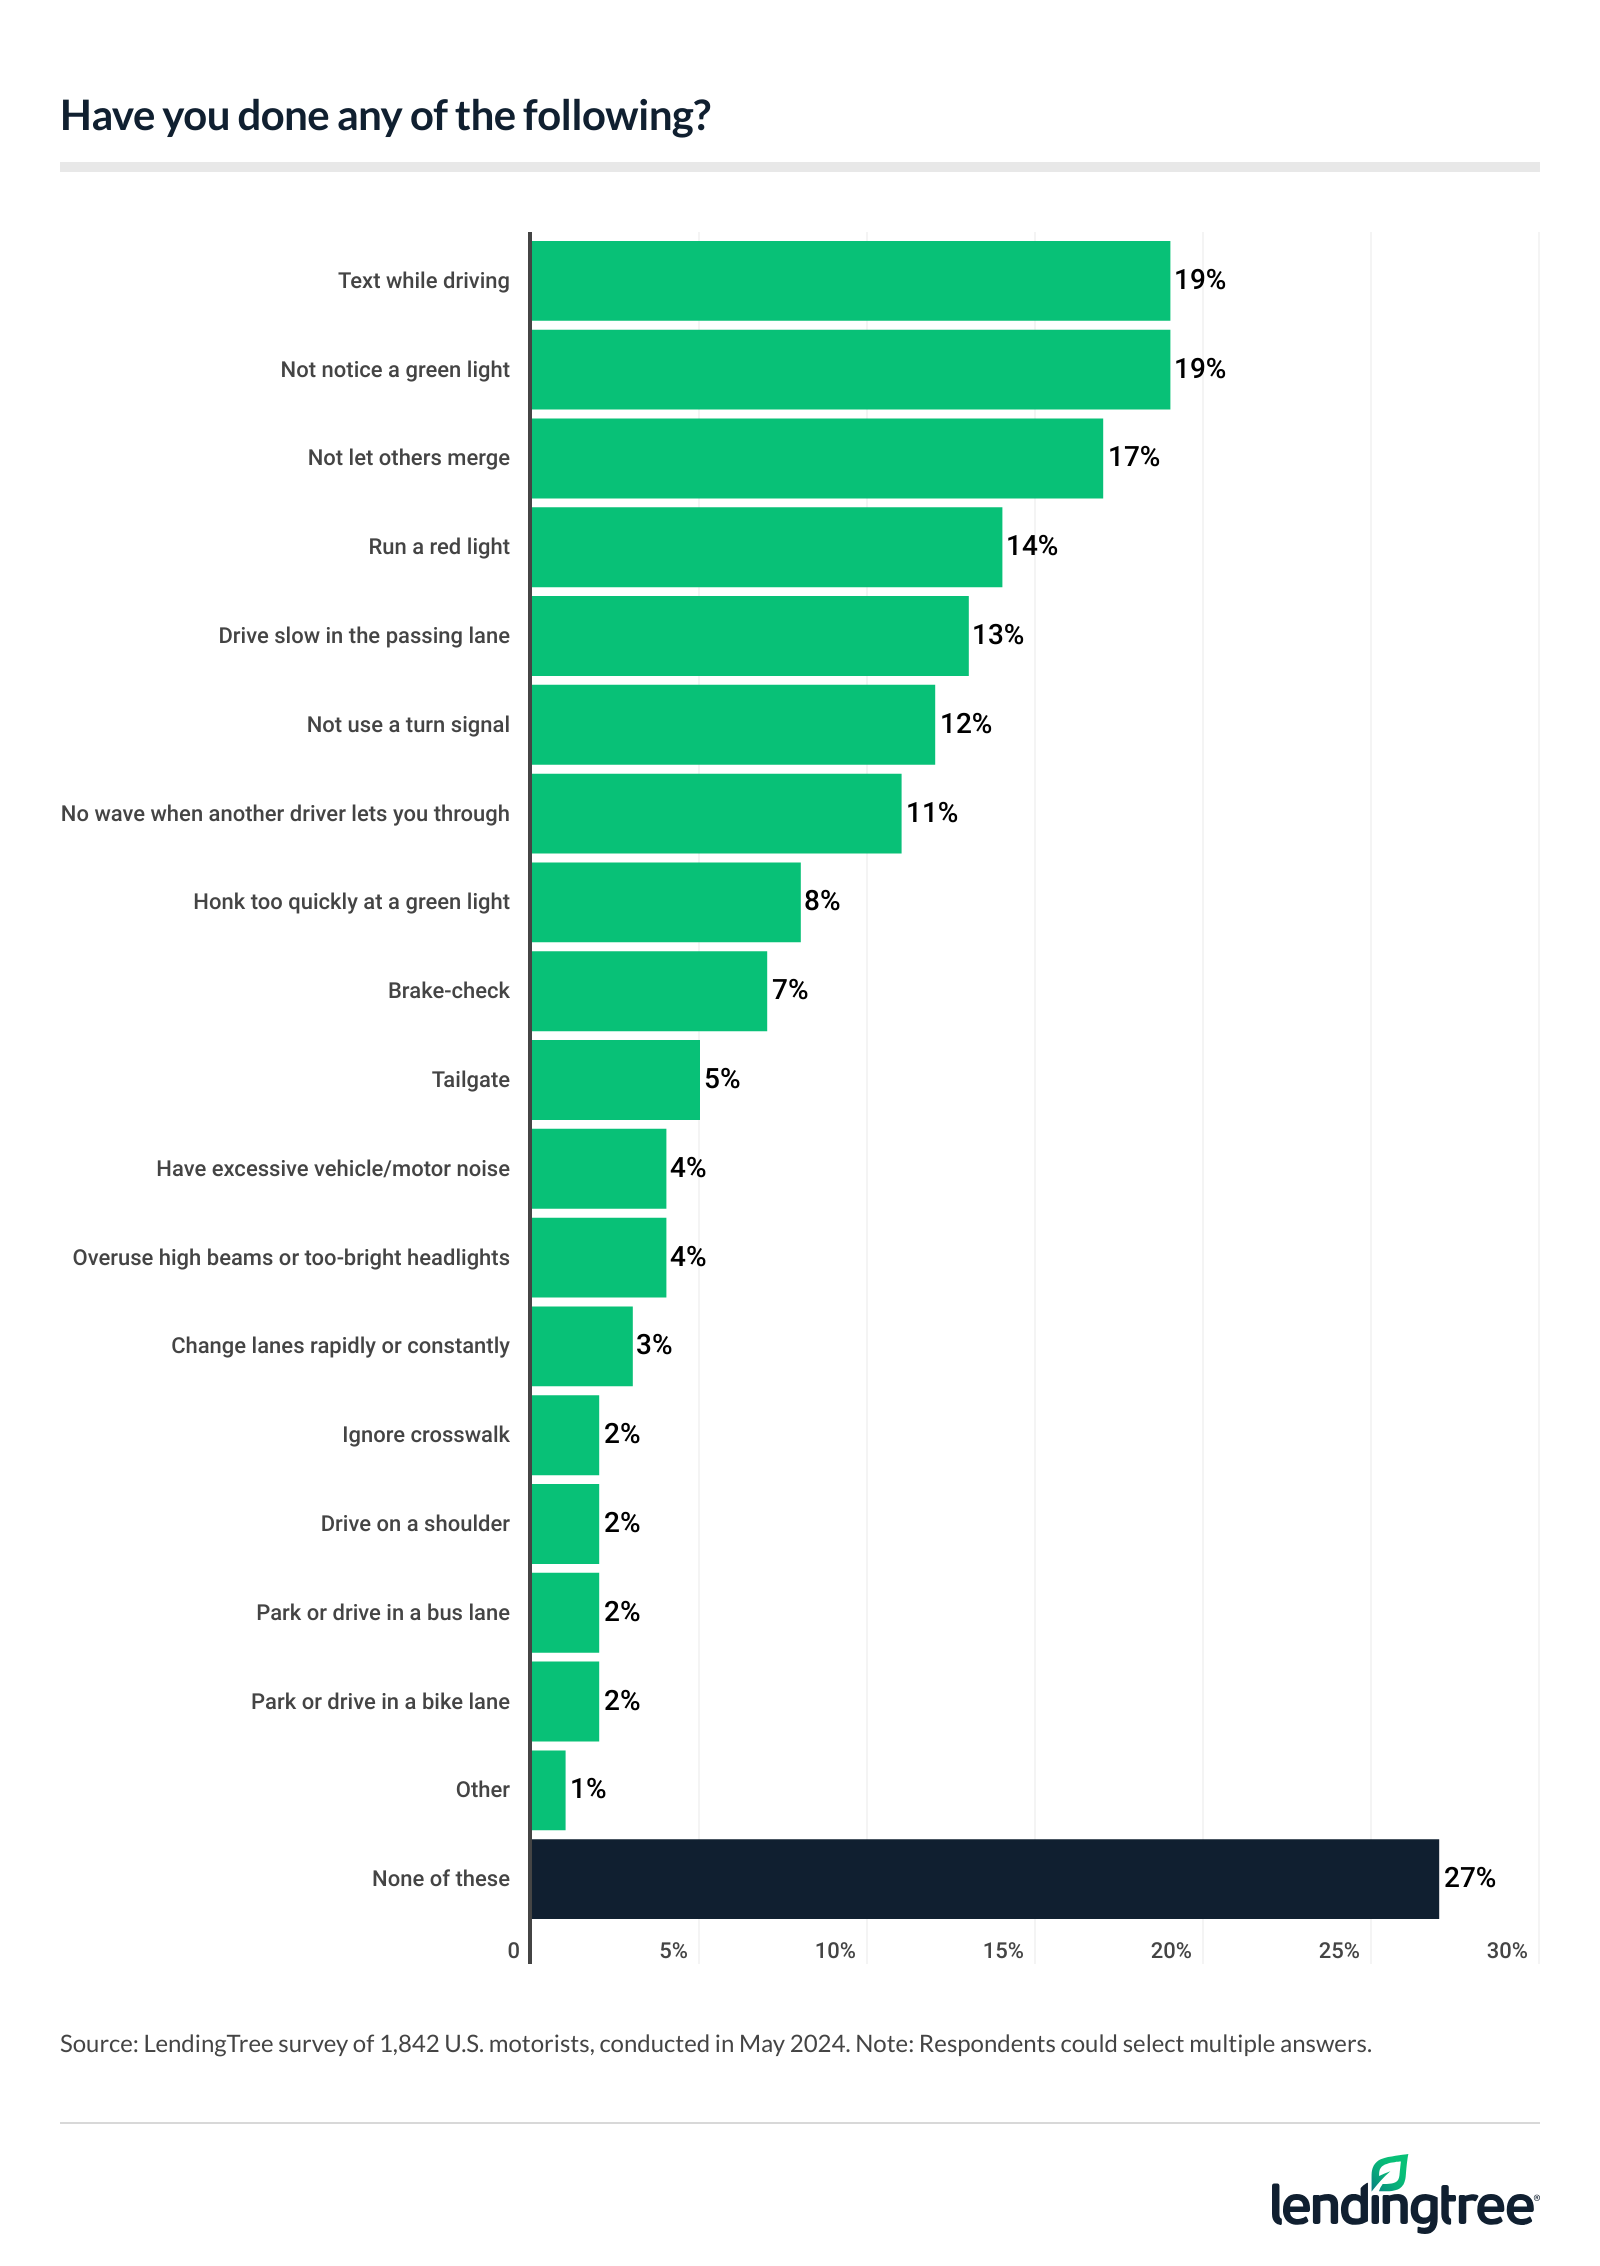
- Fewer drivers admit to being guilty of pet peeves. Just over a quarter (27%) say they’ve never committed any of the listed pet peeves. When asked about their guilt, the most common offenses were texting while driving (19%), not noticing a green light (19%) and not letting others merge (17%).
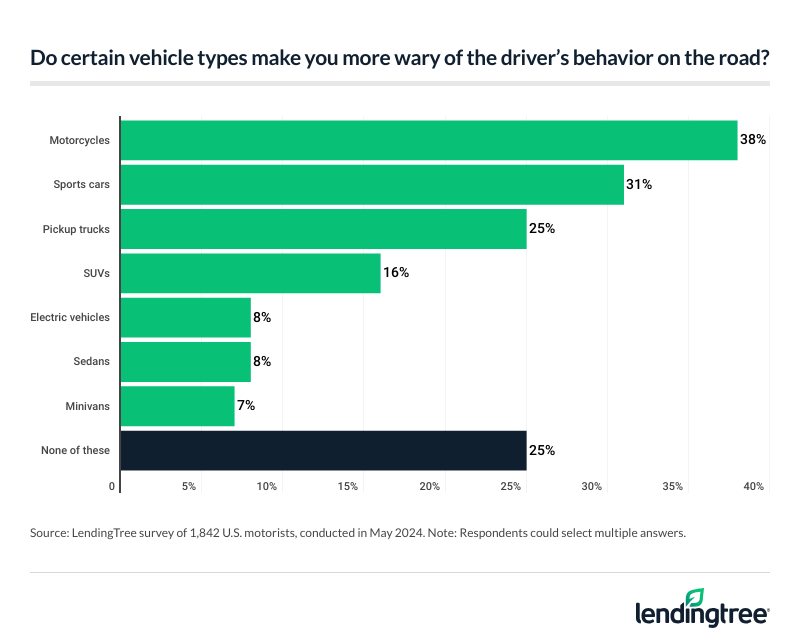
- Many are judging drivers by their vehicles. Three-quarters (75%) of drivers say certain types of vehicles make them more wary of another driver’s behavior — particularly motorcycles (38%), sports cars (31%) and pickup trucks (25%). Additionally, 24% admit to passing judgment based on the make of other vehicles.
- Driving annoyances may be more than a pet peeve for some. Even though just 23% of Americans say they’re easily angered while driving, 50% of motorists admit they’ve had road rage. Men are more likely than women to have experienced road rage (56% versus 43%), while Gen Zers (62%) and millennials (59%) are also most prone to it.
- Not everyone is keeping their rage to themselves. Half (50%) of those who’ve had road rage say it caused them to drive more aggressively. In fact, 50% of drivers say they’ve used obscene language or hand gestures toward other drivers, while 57% have used their horns to “scold” others on the road.
Texting while driving is the top pet peeve
Unsurprisingly, the majority (92%) of drivers have a pet peeve, but which are the worst offenders? Among motorists, 54% get annoyed by texting while driving. Following that, 44% get annoyed by drivers going slow in the passing lane, and 41% dislike drivers who don’t let you merge.

While these are all annoying behaviors, LendingTree auto insurance expert and licensed insurance agent Rob Bhatt says some are worse than others.
“Texting while driving is deadly and inexcusable,” he says. “In the amount of time it takes to send a note or check your screen, you can miss seeing cars stopped in unexpected freeway traffic in front of you or a worker on the side of the road. It’s 100% avoidable. Most states ban texting and driving, and getting a ticket for distracted driving can increase your insurance rates.”
48% of motorists say they live in a state with distracted driving laws and approve of them. Alarmingly, 31% don’t know whether they live in a state with related laws.
When asked what pet peeves they notice most frequently, 15% of drivers cite others going slow in the passing lane. That’s followed by drivers that don’t let you merge (13%) and those not using turn signals (12%). Following that, drivers are more likely to notice other drivers:
- Tailgating (11%)
- Speeding up during a yellow light (8%)
- Honking too quickly at a green light (7%)
- Overusing high beams or having headlights that are too bright (5%)
- Rapidly or constantly changing lanes (5%)
- Not noticing a green light (4%)
- Having excessive vehicle/motor noise (4%)
- Not waving when one is warranted (3%)
- Ignoring crosswalks (3%)
- Brake-checking (2%)
- Parking or driving in bus lanes (1%)
- Driving on a shoulder (1%)
Beyond these pet peeves, half (50%) of motorists say slow drivers are more annoying than fast ones, with Gen Zers ages 18 to 27 (58%) the most likely to get annoyed by slow drivers. Meanwhile, just 36% of motorists say fast drivers are more annoying and 15% are impartial.
Looking locally, 41% of motorists think drivers in their area are worse than in comparable cities or towns.
Many drivers say they aren’t guilty of these pet peeves
Despite the long list of pet peeves and the high percentage of drivers that have them, 27% say they’ve never committed any.
Women (32%) are more likely than men (24%) to say they’ve never committed any of the pet peeves listed. By age group, baby boomers ages 60 to 78 (37%) are the most likely to say this.
Of the pet peeves drivers admit to doing, texting while driving and not noticing a green light (both 19%) top the list. That’s followed by not letting other drivers merge (17%).

How might these behaviors impact a driver’s liability in an accident? Bhatt says you’re responsible for injuries and damage you cause to others in a car accident in most states. However, many states also have partial-fault laws that reduce the amounts you may owe if the other driver is partially to blame.
“If witness statements or other evidence show you were texting, ran a red light or failed to yield properly, it’s going to be tough to convince anyone that the other driver contributed to the accident,” he says. “This can put 100% of the liability on you.”
Drivers are judging others by their vehicles
As for the type of vehicle others are driving, the majority of drivers say they discriminate. In fact, 75% of motorists say certain types of vehicles make them more wary of another driver’s behavior, with motorcycles (38%), sports cars (31%) and pickup trucks (25%) topping the list.

It’s not just the type of vehicle — the make matters to some, too. A quarter (24%) admit to judging others based on the make of their vehicles. That’s especially true among those with children younger than 18 (33%), millennials ages 28 to 43 (32%) and Gen Zers (31%). Men (29%) are also significantly more likely to judge a vehicle make than women (19%).
There may be good reasons to be wary of certain vehicle makes. According to another LendingTree study on vehicle brand incidents, Ram, Tesla and Subaru drivers were the most likely to have driving incidents (accidents, DUIs, speeding and citations). Meanwhile, BMW drivers had the highest DUI rate.
Half of American motorists have had road rage
Despite these pet peeves, just under a quarter (23%) of Americans say they’re easily angered while driving. That figure rises to 30% among millennials — the highest by age group. Additionally, men are more likely to be easily angered than women, at 27% versus 18%.
Parents with children younger than 18 (32%) are also much more likely than those without children (21%) to say they’re easy to anger while driving.
But for some, these pet peeves are more than just that. In fact, half (50%) of motorists admit they’ve had road rage — particularly Gen Zers (62%), those with children younger than 18 (61%) and millennials (59%).

Men are also more likely than women to have experienced road rage (56% versus 43%).
Drivers with road rage lash out at others
Road rage can come with consequences — and 50% of those who’ve had it say it caused them to drive more aggressively, with those with children younger than 18 (61%) the most likely to admit to this.
That’s also significantly more true for men (57%) than women (39%). Meanwhile, 56% of millennials and 55% of Gen Xers ages 44 to 59 say they’ve driven more aggressively due to road rage. That compares with just 44% of Gen Zers and 31% of baby boomers.
Beyond this, 50% of drivers say they’ve used obscene language or hand gestures toward other drivers, a figure that’s highest among Gen Xers (55%) and those with children younger than 18 (55%). Meanwhile, 57% of motorists have used their horns to “scold” others on the road.
Managing road rage: Top expert tips
Whether you’re an angry driver or not, you should be prepared to encounter road rage at some point. To help manage road rage, consider the following advice:
- Practice patience. “A little patience goes a long way,” Bhatt says. “You can’t expect everyone on the road to be as good of a driver as you. Other drivers are going to make mistakes. Believe it or not, you’ll probably make a mistake in your driving life.”
- Defensive driving is crucial. “Defensive driving is about more than being cautious,” he says. “It’s about paying attention to your entire driving environment, including vehicles you can see approaching from behind in your mirrors. When you’re aware of the situation and anticipate potential hazards, you can usually take steps to prevent someone or something from posing a danger to you.”
- Consider additional coverage. If you find yourself in an accident due to road rage, personal injury protection (PIP) can help pay for injuries regardless of whose fault it is. (Note: Not all states have PIP.) Additionally, uninsured motorist (UM) or collision coverage may help protect you financially.
Methodology
LendingTree commissioned QuestionPro to conduct an online survey of 2,042 U.S. consumers ages 18 to 78 from May 10 to 13, 2024. The survey was administered using a nonprobability-based sample, and quotas were used to ensure the sample base represented the overall population. Researchers reviewed all responses for quality control.
We defined generations as the following ages in 2024:
- Generation Z: 18 to 27
- Millennial: 28 to 43
- Generation X: 44 to 59
- Baby boomer: 60 to 78

