Tornado Alley Residents Pay the Most Toward Home Insurance


Homeowners know insurance is a pricey necessity, but how much of their income are they putting toward insurance?
Our latest study found that households spend an average of 2.41% of their annual income on home insurance. By state, that figure varies from 0.48% to 6.84%.
Here’s a closer look.
Key findings
- American households spend an average of 2.41% of their annual income on home insurance. Households earn an average of $116,273 annually, $2,801 of which goes toward home insurance.
- Households in prominent Tornado Alley states — Oklahoma, Nebraska and Kansas — spend the highest percentage of their income on home insurance. Oklahoma is the highest, with 6.84% or $6,133 of household income for home insurance. This is more than a percentage point higher than in the next highest state, Nebraska, at 5.73% or $5,912. Kansas is third at 5.58% or $5,412.
- Hawaii households spend the smallest percentage of income on home insurance. Just 0.48% or $632 of household income goes toward home insurance in the state, ahead of California (0.88% or $1,260) and the District of Columbia (1.04% or $1,764).
- American households spent 4.63% more of their income on home insurance in 2024. Households spent 2.30% or $2,544 of their income toward home insurance in 2023, with an uptick in 2024 to 2.41% or $2,801. The five states (although not in the same order) by percentage of income toward home insurance stayed the same in both years: Oklahoma, Nebraska, Kansas, Kentucky and Mississippi.
- Nebraska, North Dakota and Montana saw the biggest increases in the percentage of income toward home insurance year over year. Nebraska saw its percentage of income toward home insurance increase by 19.90% from 2023 to 2024. North Dakota (18.62%) and Montana (17.40%) trailed.
Households spend 2.41% of income on home insurance
American households earn an average of $116,273 annually, putting $2,801 toward home insurance. That means these households spend an average of 2.41% on home insurance.
LendingTree home insurance expert and licensed insurance agent Rob Bhatt says this figure is slightly higher today than anyone would have expected just a decade ago.
“Home insurance costs as a share of income were much lower in the early 2000s,” he says. “Homeowners insurance generally remains affordable when premiums remain at or below inflation and wage growth. Unfortunately, we’ve seen insurance rate increases outpace both these things over the past few years. Homeowners insurance is taking an increasingly larger bite out of household budgets. This is creating real financial pain for a lot of people.”
While $2,801 is the average cost of a home insurance policy, that figure can vary a lot depending on your coverage (and location, which we’ll get into later). Also of note, home insurance rates have risen significantly over the years, increasing 37.8% cumulatively from 2019 through March 2024, according to LendingTree’s State of Home Insurance.
Insurance takes biggest chunk of income in Tornado Alley states
As for the states that put the most toward home insurance, those in Tornado Alley — areas with increased risk of tornadoes — rank highest. Oklahoma is first, dedicating 6.84% of residents’ average household income of $89,649 to home insurance. That translates to $6,133.
While Oklahoma had 74 tornadoes in 2023, according to the National Weather Service, it had a notable 152 in 2024 — the highest number in the state dating back to 1950. That means rates may continue to rise significantly.
The next highest state, Nebraska, trailed at 5.73% or $5,912 of the average household income of $103,129.
States where residents put highest % of income toward home insurance, 2024
| Rank | State | Avg. household income | Avg. home insurance cost | % of income |
|---|---|---|---|---|
| 1 | Oklahoma | $89,649 | $6,133 | 6.84% |
| 2 | Nebraska | $103,129 | $5,912 | 5.73% |
| 3 | Kansas | $97,008 | $5,412 | 5.58% |
Kansas is third, with households dedicating 5.58% or $5,412 toward home insurance.
Bhatt reiterated tornadoes are largely to blame for the high insurance rates here. According to the National Oceanic and Atmospheric Administration (NOAA), severe storms like tornadoes are the leading cause of billion-dollar disasters in all three of these states.
“This uptick in severe storms is exacerbated by inflation,” Bhatt says. “Insurance companies are paying to rebuild a larger number of homes per client in these areas, and each home costs more to rebuild. These types of cost increases get passed down to customers in the form of higher rates.” Still, Bhatt says, insurance commissioners in many states have the authority to approve or deny rate increases that the insurance companies propose, and insurance companies have to prove their expenses justify these rate increases. “So far, insurance commissioners in many states agree that insurance companies need higher insurance rates,” he says.
Hawaii households put least income toward home insurance
Hawaii households spend the lowest rate of their income on home insurance. While they make $132,473 annually, they spend just $632 on insurance, or 0.48%.
That said, Hawaii’s high cost of living and generally high housing prices can’t be understated. A LendingTree study on states with “house poor” residents (meaning homeowners spending more than 30% of their monthly income on housing costs) ranked Hawaii second. Hawaii had 28.70% of residents deemed house poor and 44.15% deemed severely housing cost-burdened.
Another LendingTree study on millennial spending power found that money is tightest for Hawaii millennials (ages 28 to 43 in 2024). Here, millennials put a significant 39.6% of their annual income toward rent.
Additionally, our rates here wouldn’t have yet reflected the 2023 Maui wildfire, which affected over 2,000 structures — although Bhatt says there were signs that insurance prices were beginning to rise before the fire.
“It’s going to take some time to find out how much of a long-term impact the wildfires will have on homeowners insurance,” he says. “However, there have already been reports of steep rate increases in recent months. The long-term rate impacts may not be as bad if the Maui wildfire turns out to be abnormal. On the other hand, if destructive wildfires become a pattern, homeowners are likely to see their rates go up by a lot.”
States where residents put lowest % of income toward home insurance, 2024
| Rank | State | Avg. household income | Avg. home insurance cost | % of income |
|---|---|---|---|---|
| 1 | Hawaii | $132,473 | $632 | 0.48% |
| 2 | California | $143,056 | $1,260 | 0.88% |
| 3 | District of Columbia | $168,968 | $1,764 | 1.04% |
California is next, dedicating $1,260 of residents’ $143,056 in annual household income toward home insurance. At 0.88%, it’s the only other state below 1.00%. That may seem surprising given the wildfire risk in California.
California was the only state that hadn’t allowed insurers to include reinsurance costs in rates. The state Department of Insurance issued a regulation to allow related costs to be factored into rate-making to require insurers to increase coverage in high-risk areas. These changes will likely first have an impact later this year or in 2026, impacting future home insurance rates.
The District of Columbia rounded out the bottom three, at 1.04% or $1,764 of the $168,968 average household income.
Notably, the states that spend the least have among the highest average household incomes. Additionally, a majority of the bottom half of states make above the U.S. average household income. In contrast, just one state among the top half dedicating the highest share of their income toward home insurance makes above the U.S. average: Minnesota.
Full rankings: States where residents put highest/lowest % of income toward home insurance, 2024
| Rank | State | Avg. household income | Avg. home insurance cost | % of income |
|---|---|---|---|---|
| 1 | Oklahoma | $89,649 | $6,133 | 6.84% |
| 2 | Nebraska | $103,129 | $5,912 | 5.73% |
| 3 | Kansas | $97,008 | $5,412 | 5.58% |
| 4 | Kentucky | $87,632 | $4,671 | 5.33% |
| 5 | Mississippi | $80,572 | $4,201 | 5.21% |
| 6 | Louisiana | $87,255 | $4,033 | 4.62% |
| 6 | Texas | $112,214 | $5,180 | 4.62% |
| 8 | Arkansas | $84,875 | $3,722 | 4.39% |
| 9 | New Mexico | $90,317 | $3,354 | 3.71% |
| 10 | South Dakota | $99,147 | $3,605 | 3.64% |
| 11 | Alabama | $90,453 | $3,217 | 3.56% |
| 12 | Florida | $109,532 | $3,889 | 3.55% |
| 13 | Missouri | $97,014 | $3,387 | 3.49% |
| 14 | Colorado | $130,580 | $4,489 | 3.44% |
| 15 | South Carolina | $98,375 | $3,335 | 3.39% |
| 16 | North Carolina | $104,728 | $3,378 | 3.23% |
| 17 | Montana | $97,839 | $3,068 | 3.14% |
| 18 | West Virginia | $80,603 | $2,511 | 3.12% |
| 19 | Minnesota | $117,468 | $3,642 | 3.10% |
| 20 | North Dakota | $97,980 | $2,911 | 2.97% |
| 21 | Tennessee | $99,800 | $2,857 | 2.86% |
| 22 | Iowa | $95,621 | $2,697 | 2.82% |
| 23 | Indiana | $96,633 | $2,643 | 2.74% |
| 24 | Georgia | $108,638 | $2,869 | 2.64% |
| 25 | Michigan | $98,268 | $2,467 | 2.51% |
| 26 | Arizona | $109,854 | $2,623 | 2.39% |
| 27 | Illinois | $115,161 | $2,743 | 2.38% |
| 27 | Wyoming | $97,643 | $2,323 | 2.38% |
| 29 | Ohio | $98,504 | $2,207 | 2.24% |
| 30 | Wisconsin | $102,521 | $2,159 | 2.11% |
| 31 | Idaho | $105,077 | $2,178 | 2.07% |
| 32 | Virginia | $130,053 | $2,499 | 1.92% |
| 33 | Connecticut | $137,834 | $2,618 | 1.90% |
| 33 | Rhode Island | $118,127 | $2,240 | 1.90% |
| 35 | Maine | $102,443 | $1,863 | 1.82% |
| 36 | Pennsylvania | $107,019 | $1,928 | 1.80% |
| 37 | Oregon | $112,742 | $1,885 | 1.67% |
| 38 | Nevada | $108,625 | $1,626 | 1.50% |
| 39 | New York | $128,437 | $1,897 | 1.48% |
| 40 | Delaware | $116,306 | $1,701 | 1.46% |
| 41 | New Hampshire | $131,555 | $1,760 | 1.34% |
| 42 | Maryland | $135,998 | $1,810 | 1.33% |
| 43 | Massachusetts | $146,033 | $1,906 | 1.31% |
| 44 | Alaska | $119,942 | $1,475 | 1.23% |
| 45 | New Jersey | $144,352 | $1,744 | 1.21% |
| 46 | Utah | $125,191 | $1,507 | 1.20% |
| 47 | Vermont | $112,077 | $1,339 | 1.19% |
| 48 | Washington | $135,848 | $1,600 | 1.18% |
| 49 | District of Columbia | $168,968 | $1,764 | 1.04% |
| 50 | California | $143,056 | $1,260 | 0.88% |
| 51 | Hawaii | $132,473 | $632 | 0.48% |
Insurance rates rising faster than income
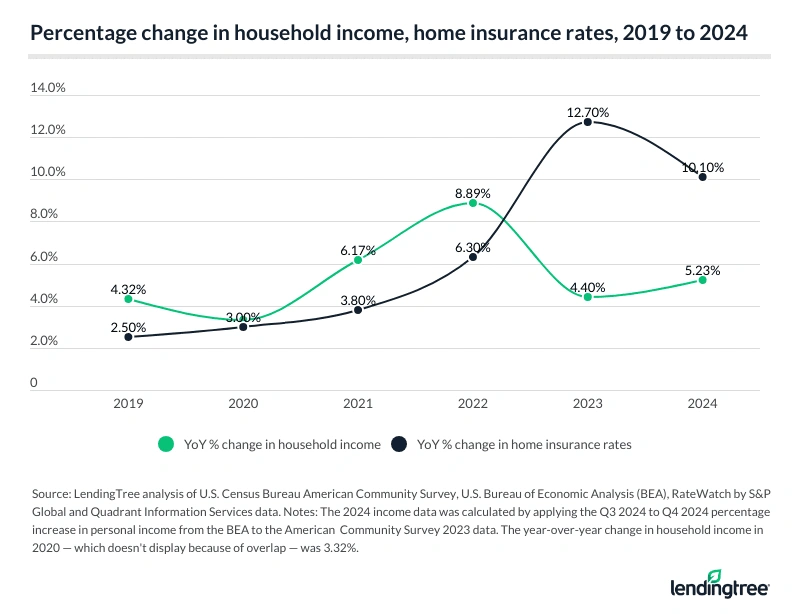
Insurance costs as a percentage of income have risen. In 2024, American households spent 4.63% more of their income on home insurance than in the prior year.
In 2023, households spent 2.30% or $2,544 toward home insurance, which rose to 2.41% or $2,801 in 2024. And while household income rose 5.23% from $110,491 to $116,273, home insurance rates rose 10.10% in the same period.
That’s a recent shift. Between 2019 and 2022, incomes rose at a slightly faster rate than home insurance. However, in 2023 and 2024, increases in home insurance rates skyrocketed beyond increases in household income, seeing double-digit jumps both years.
Bhatt believes there are a few reasons for this sudden increase in insurance rates.
“There has been an uptick in climate-related disasters — like hurricanes, wildfires, tornadoes and severe storms — over the past decade,” he says. “Inflation is compounding the issue. More disasters mean insurance companies are paying to rebuild more homes per customer than they used to. Inflation has insurance companies paying more to rebuild each one. These are costs that insurance companies pass on to customers in the form of higher home insurance rates.”
Turning back to 2023 so we could compare, the five states by percentage of income toward home insurance stayed the same as in 2024, although in a different order. Oklahoma ranked first, dedicating 6.59% or $5,648 toward home insurance costs in 2023. Kansas (5.10% or $4,781) and Kentucky (5.03% or $4,197) followed.
States where residents put highest % of income toward home insurance, 2023
| Rank | State | Avg. household income | Avg. home insurance cost | % of income |
|---|---|---|---|---|
| 1 | Oklahoma | $85,650 | $5,648 | 6.59% |
| 2 | Kansas | $93,781 | $4,781 | 5.10% |
| 3 | Kentucky | $83,499 | $4,197 | 5.03% |
Meanwhile, Hawaii, California and the District of Columbia maintained their rankings at the bottom.
Full rankings: States where residents put highest/lowest % of income toward home insurance, 2023
| Rank | State | Avg. household income | Avg. home insurance cost | % of income |
|---|---|---|---|---|
| 1 | Oklahoma | $85,650 | $5,648 | 6.59% |
| 2 | Kansas | $93,781 | $4,781 | 5.10% |
| 3 | Kentucky | $83,499 | $4,197 | 5.03% |
| 4 | Mississippi | $76,305 | $3,778 | 4.95% |
| 5 | Nebraska | $101,268 | $4,842 | 4.78% |
| 6 | Texas | $106,549 | $5,010 | 4.70% |
| 7 | Louisiana | $83,303 | $3,772 | 4.53% |
| 8 | Arkansas | $81,056 | $3,312 | 4.09% |
| 9 | Florida | $103,634 | $3,824 | 3.69% |
| 10 | New Mexico | $85,782 | $2,998 | 3.49% |
| 11 | Alabama | $85,530 | $2,914 | 3.41% |
| 12 | South Carolina | $92,578 | $3,054 | 3.30% |
| 13 | Colorado | $124,578 | $4,012 | 3.22% |
| 13 | South Dakota | $96,650 | $3,110 | 3.22% |
| 15 | North Carolina | $98,139 | $3,151 | 3.21% |
| 16 | Missouri | $93,074 | $2,910 | 3.13% |
| 17 | West Virginia | $76,585 | $2,276 | 2.97% |
| 18 | Tennessee | $94,180 | $2,602 | 2.76% |
| 19 | Minnesota | $113,293 | $3,048 | 2.69% |
| 20 | Montana | $94,069 | $2,513 | 2.67% |
| 21 | Indiana | $91,900 | $2,339 | 2.55% |
| 22 | North Dakota | $98,324 | $2,463 | 2.50% |
| 23 | Wyoming | $93,304 | $2,323 | 2.49% |
| 23 | Georgia | $103,146 | $2,564 | 2.49% |
| 25 | Iowa | $93,942 | $2,291 | 2.44% |
| 26 | Michigan | $93,806 | $2,214 | 2.36% |
| 27 | Arizona | $104,620 | $2,330 | 2.23% |
| 28 | Illinois | $110,930 | $2,406 | 2.17% |
| 29 | Ohio | $93,500 | $1,996 | 2.13% |
| 30 | Idaho | $98,653 | $1,971 | 2.00% |
| 31 | Wisconsin | $97,894 | $1,870 | 1.91% |
| 32 | Virginia | $123,132 | $2,274 | 1.85% |
| 33 | Maine | $97,157 | $1,741 | 1.79% |
| 34 | Rhode Island | $113,091 | $2,007 | 1.77% |
| 35 | Connecticut | $131,007 | $2,283 | 1.74% |
| 36 | Pennsylvania | $102,578 | $1,699 | 1.66% |
| 37 | Oregon | $107,214 | $1,736 | 1.62% |
| 38 | Nevada | $103,067 | $1,559 | 1.51% |
| 39 | New York | $122,227 | $1,828 | 1.50% |
| 40 | Delaware | $109,486 | $1,586 | 1.45% |
| 41 | New Hampshire | $124,500 | $1,597 | 1.28% |
| 41 | Massachusetts | $138,516 | $1,766 | 1.28% |
| 43 | Maryland | $129,366 | $1,638 | 1.27% |
| 44 | Alaska | $114,201 | $1,382 | 1.21% |
| 45 | Vermont | $105,931 | $1,272 | 1.20% |
| 46 | New Jersey | $138,153 | $1,586 | 1.15% |
| 47 | Utah | $117,752 | $1,284 | 1.09% |
| 48 | Washington | $129,161 | $1,339 | 1.04% |
| 49 | District of Columbia | $160,752 | $1,654 | 1.03% |
| 50 | California | $134,491 | $1,110 | 0.83% |
| 51 | Hawaii | $124,713 | $567 | 0.45% |
Nebraska saw biggest jump in share of income going toward home insurance costs
Now that we’ve detailed the 2023 and 2024 data, we can highlight the states that saw the biggest year-over-year jumps in the percentage of income going toward home insurance. Nebraska ranked first. Between 2023 and 2024, the percentage of income toward home insurance increased by 19.90%.
North Dakota (18.62%) and Montana (17.40%) followed.
States with biggest increases in % of income toward home insurance, 2023-24
| Rank | State | % of income, 2023 | % of income, 2024 | % change |
|---|---|---|---|---|
| 1 | Nebraska | 4.78% | 5.73% | 19.90% |
| 2 | North Dakota | 2.50% | 2.97% | 18.62% |
| 3 | Montana | 2.67% | 3.14% | 17.40% |
Meanwhile, just six states saw this percentage decrease between 2023 and 2024. Wyoming (down 4.44%) led, seeing no change in average insurance costs but a modest income bump. Florida (down 3.78%) and Texas (down 1.82%) followed, with both states experiencing a slight increase in average insurance costs and a more significant increase in income.
Full rankings: States with biggest increases/decreases in % of income toward home insurance, 2023-24
| Rank | State | % of income, 2023 | % of income, 2024 | % change |
|---|---|---|---|---|
| 1 | Nebraska | 4.78% | 5.73% | 19.90% |
| 2 | North Dakota | 2.50% | 2.97% | 18.62% |
| 3 | Montana | 2.67% | 3.14% | 17.40% |
| 4 | Iowa | 2.44% | 2.82% | 15.63% |
| 5 | Minnesota | 2.69% | 3.10% | 15.25% |
| 6 | Washington | 1.04% | 1.18% | 13.62% |
| 7 | South Dakota | 3.22% | 3.64% | 12.98% |
| 8 | Missouri | 3.13% | 3.49% | 11.67% |
| 9 | Utah | 1.09% | 1.20% | 10.42% |
| 10 | Wisconsin | 1.91% | 2.11% | 10.29% |
| 11 | Illinois | 2.17% | 2.38% | 9.81% |
| 12 | Kansas | 5.10% | 5.58% | 9.43% |
| 13 | Connecticut | 1.74% | 1.90% | 9.02% |
| 14 | Pennsylvania | 1.66% | 1.80% | 8.79% |
| 15 | Indiana | 2.55% | 2.74% | 7.47% |
| 16 | Arkansas | 4.09% | 4.39% | 7.34% |
| 17 | Arizona | 2.23% | 2.39% | 7.24% |
| 18 | Rhode Island | 1.77% | 1.90% | 6.84% |
| 19 | California | 0.83% | 0.88% | 6.80% |
| 20 | Colorado | 3.22% | 3.44% | 6.76% |
| 21 | Michigan | 2.36% | 2.51% | 6.34% |
| 22 | New Mexico | 3.49% | 3.71% | 6.28% |
| 23 | Georgia | 2.49% | 2.64% | 6.24% |
| 24 | Kentucky | 5.03% | 5.33% | 6.05% |
| 25 | Mississippi | 4.95% | 5.21% | 5.31% |
| 26 | New Jersey | 1.15% | 1.21% | 5.28% |
| 27 | Maryland | 1.27% | 1.33% | 5.11% |
| 28 | Ohio | 2.13% | 2.24% | 4.98% |
| 29 | West Virginia | 2.97% | 3.12% | 4.80% |
| 30 | Hawaii | 0.45% | 0.48% | 4.78% |
| 31 | Alabama | 3.41% | 3.56% | 4.39% |
| 32 | New Hampshire | 1.28% | 1.34% | 4.29% |
| 33 | Virginia | 1.85% | 1.92% | 4.05% |
| 34 | Oklahoma | 6.59% | 6.84% | 3.76% |
| 35 | Idaho | 2.00% | 2.07% | 3.74% |
| 36 | Tennessee | 2.76% | 2.86% | 3.62% |
| 37 | Oregon | 1.62% | 1.67% | 3.27% |
| 38 | South Carolina | 3.30% | 3.39% | 2.77% |
| 39 | Massachusetts | 1.28% | 1.31% | 2.35% |
| 40 | Louisiana | 4.53% | 4.62% | 2.06% |
| 41 | Alaska | 1.21% | 1.23% | 1.59% |
| 42 | Maine | 1.79% | 1.82% | 1.48% |
| 43 | District of Columbia | 1.03% | 1.04% | 1.42% |
| 44 | Delaware | 1.45% | 1.46% | 0.91% |
| 45 | North Carolina | 3.21% | 3.23% | 0.46% |
| 46 | Vermont | 1.20% | 1.19% | -0.57% |
| 47 | Nevada | 1.51% | 1.50% | -1.04% |
| 48 | New York | 1.50% | 1.48% | -1.22% |
| 49 | Texas | 4.70% | 4.62% | -1.82% |
| 50 | Florida | 3.69% | 3.55% | -3.78% |
| 51 | Wyoming | 2.49% | 2.38% | -4.44% |
Finding affordable home insurance: Top tips for 2025
If your home insurance is taking an increasing chunk of your income, there are a few things you can do to get your rates back down. Particularly, Bhatt recommends the following:
- Shop around. “Each company uses a different system to calculate your rates, and they’re continuously updating the formulas,” he says. “A company that quoted you a high rate a few years ago may be a cheaper option now. It’s a bit of a pain to contact a bunch of different companies for quotes, but the potential for savings makes it worth the effort.”
- Increase your deductible. This is another way to bring down your rate without sacrificing coverage. You’ll just have to pay more out of pocket if a disaster strikes.
- Invest in home improvements that help your home withstand the disaster risks in your area. “If you live in an area with hurricane risks, install wind-resistant roofing and windows,” he says. “If you live in an area with wildfire risks, switch to fire-resistant building materials and maintain brush-free defensible space. Plus, taking steps to protect your home from a disaster can sometimes get you an insurance discount. Better yet, doing so may save your home if a disaster does strike.”
Methodology
LendingTree analysts pulled average household incomes from the U.S. Census Bureau 2023 American Community Survey with five-year estimates. We utilized U.S. Bureau of Economic Analysis (BEA) personal income data from Q3 2023 and Q4 2024 to estimate average household incomes in 2024.
Separately, LendingTree analysts used insurance rate data from Quadrant Information Services. These rates were publicly sourced from insurer filings and should be used only for comparative purposes, as your quotes may differ.
Our home insurance rates, from January 2024, reflect the cost to insure a median-value home in each state in 2024. The coverage and deductibles included:
- $400,000 dwelling coverage
- $40,000 other structures
- $200,000 personal property
- $80,000 loss-of-use coverage
- $100,000 liability
- $5,000 medical payments
- $1,000 deductible
To estimate 2023 home insurance rates, we divided the 2024 insurance rates for each state by the inverse of their rate increases in 2024. Home insurance rate change data was sourced from RateWatch by S&P Global.
Correction: An earlier version of this study said insurance commissioners in every state have the authority to approve or deny rate increases. Insurance companies in some states, including Oklahoma, don’t need regulatory approval to raise rates.