High-Mileage Heroes of the Road: Mitsubishi, Chevrolet, Nissan


On the road again. And again. And again. That’s what Mitsubishi drivers should be singing, according to LendingTree’s latest study. Mitsubishi leads the pack in average miles driven per year, and Chevy and Nissan drivers aren’t far behind.
Using more than 1 million auto loan inquiries on the LendingTree platform, we analyzed what people are driving, where they’re driving and how much they’re driving. Why does it matter? How much you — and others — are on the road can affect your car insurance rate.
Plus, stick around to learn which brands have the highest odometer readings. (Spoiler alert: Land Rover has the highest average odometer reading among vehicles with 200,000+ miles, at 274,223.)
Key findings
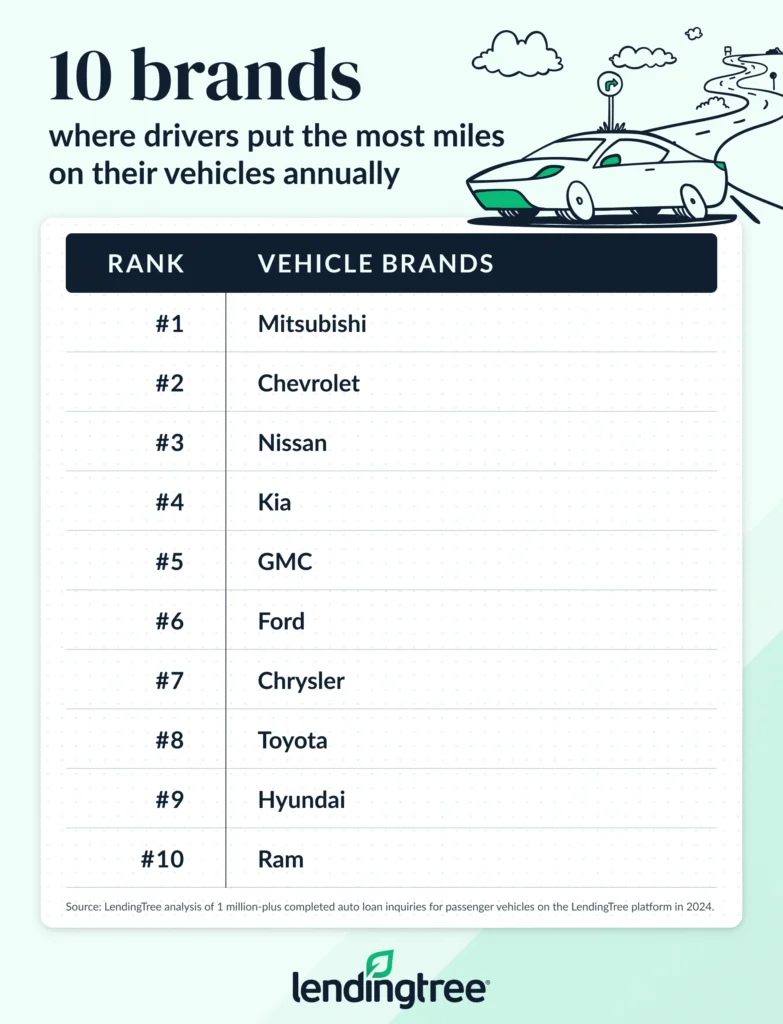
- Mitsubishi drivers put the most miles on their vehicles. Nationally, Mitsubishi drivers put an average of 18,294 miles on their vehicles per year, ahead of Chevrolet (17,689) and Nissan (17,523) drivers. Conversely, Porsche (12,280 miles), Volvo (12,974) and Lincoln (13,239) drivers put the least annual strain on their vehicles.
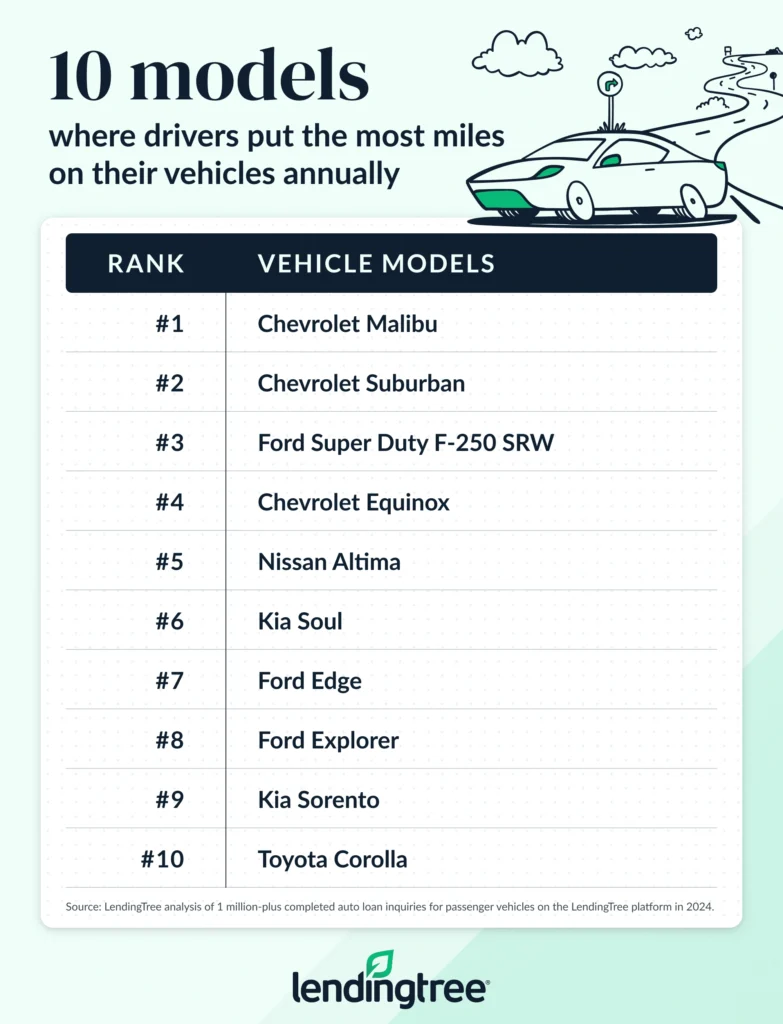
- By model (and by far), Chevrolet Malibu drivers push their vehicles to the limit the most. The Malibu is the only model to average more than 20,000 miles annually — 21,738, to be exact. Chevy Suburban (19,315) and Ford Super Duty F-250 SRW (19,148) drivers are next. Among the 100 vehicle models with the highest number of insurance inquiries in 2024, it’s another Chevy — the Corvette — at the bottom of the list at an average of 11,572 miles a year.
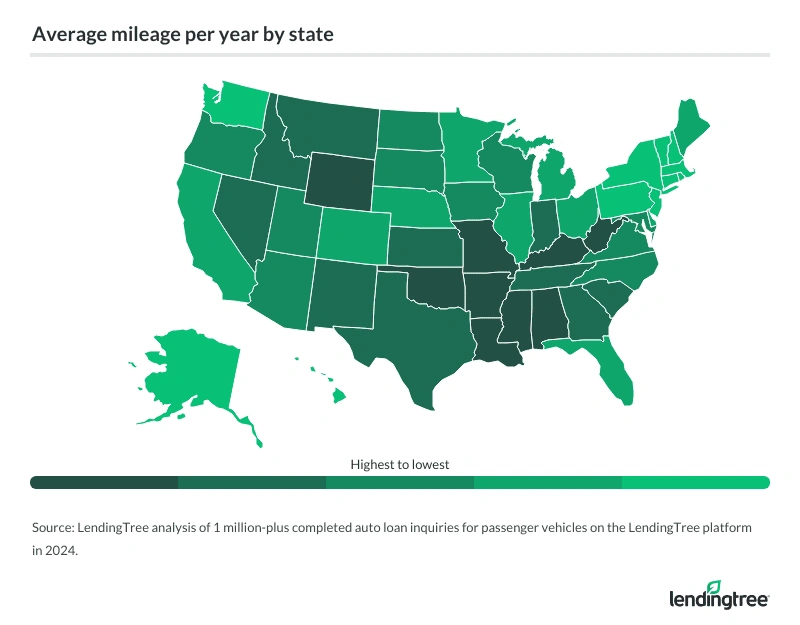
- Southern drivers have the highest average mileage per year. Mississippi drivers put an average of 19,430 miles on their vehicles annually, joined by nearby Arkansas (18,656) and Alabama (18,292). The lowest-mileage drivers are spread out — Hawaii (12,977 miles), Alaska (13,692) and New York (13,869).
- Land Rover reigns supreme when it comes to the highest odometer readings. With an average odometer reading of 274,223, Land Rovers have the highest average odometer readings of the car insurance inquiries we analyzed for vehicles with 200,000+ miles. Kia and Mazda aren’t too far behind (261,687 and 257,907, respectively).
We analyzed more than 1 million car insurance inquiries requested on the LendingTree platform in 2024. For our main analysis, we included inquiries for vehicles model year 2019 to 2023 with a self-reported annual mileage between 5,000 and 300,000.
Although our data is based on inquiries, LexisNexis Risk Solutions reports that 52.6% of car shoppers purchase the same brand of car that they currently own.
Whether these insurance shoppers were purchasing a new car or inquiring about one they already have, we’ve used this data to categorize drivers based on car brand and model. We’ve also used this data to find that the average annual mileage across the 50 U.S. states and D.C. is 16,113.
Mitsubishi drivers log the most miles per year, by car brand
Do Mitsubishi drivers have an adventurous streak? According to our latest study, maybe so. That, or they could have long commutes. Regardless, at 18,294 average annual miles per year, Mitsubishi drivers log more miles than any other car brand we analyzed.
Chevrolet and Nissan come next, with 17,689 and 17,523 average annual miles, only a little more than the national average of 16,113.
Why does it matter which car brands get driven the most? According to LendingTree auto insurance expert and licensed insurance agent Rob Bhatt, how often your brand of vehicle is on the road can affect how much you pay for insurance, even if you drive very little.
He says: “The average mileage of a particular model doesn’t affect your rate, at least not directly. But if a certain car is on the road more often than others, it may have a higher-than-average crash rate. If a particular model has a high crash rate, it’s probably going to cost more to insure than an average vehicle.”
Insurance companies look at the statistical likelihood that you’ll be involved in a car accident, and some of the factors are the year, make and model of your car. The more your particular type of car is on the road, the more opportunity it has to be involved in a crash. Regardless of how much you personally drive, your insurance premiums could reflect that extra risk.
Porsche drivers log the fewest miles per year, by car brand
Luxury vehicle owners tend to baby their toys. Take Porsche, for example. Porsche drivers log an average of just 12,280 miles a year. That’s almost 24% fewer miles than the average across the 50 states and D.C. of 16,113.
Volvo and Lincoln drivers also seem to keep their cars garaged. These models have an annual average mileage of 12,974 and 13,239. Volvo and Lincoln buyers tend to skew older, so a lack of commute might mean less time behind the wheel.
Full rankings: Average annual mileage by car brand
| Rank | Vehicle make | Avg. miles/year |
|---|---|---|
| 1 | Mitsubishi | 18,294 |
| 2 | Chevrolet | 17,689 |
| 3 | Nissan | 17,523 |
| 4 | Kia | 17,367 |
| 5 | GMC | 17,259 |
| 6 | Ford | 17,045 |
| 7 | Chrysler | 16,731 |
| 8 | Toyota | 16,480 |
| 9 | Hyundai | 16,465 |
| 10 | Ram | 16,460 |
| 11 | Honda | 16,095 |
| 12 | Jeep | 15,900 |
| 13 | Infiniti | 15,490 |
| 14 | Dodge | 15,227 |
| 15 | Volkswagen | 15,178 |
| 16 | Buick | 14,827 |
| 17 | Subaru | 14,705 |
| 18 | Cadillac | 14,580 |
| 19 | Acura | 14,174 |
| 20 | Mazda | 14,033 |
| 21 | Audi | 13,969 |
| 22 | Tesla | 13,896 |
| 23 | BMW | 13,779 |
| 24 | Lexus | 13,694 |
| 25 | Mercedes-Benz | 13,654 |
| 26 | Land Rover | 13,483 |
| 27 | Genesis | 13,331 |
| 28 | Lincoln | 13,239 |
| 29 | Volvo | 12,974 |
| 30 | Porsche | 12,280 |
Chevrolet Malibu drivers rack up the most miles per year, by car model
Chevy discontinued the Malibu in November 2024 to focus on electric vehicle (EV) and SUV production, making it the brand’s last sedan. But that hasn’t stopped current Malibu drivers from hitting the road, and hard. Malibu drivers put an average of 21,738 on their odometers each year — nearly 35% more than the across-the-U.S. average of 16,113.
Ranking in spots two and three are the Chevy Suburban (19,315 miles a year) and the Ford Super Duty F-250 SRW (19,148).
Chevrolet Corvette drivers rack up the fewest miles per year, by car model
Another luxury vehicle earns the title of least-driven car, but by car model this time. Corvette drivers travel just 11,572 miles a year, about 28% less than average. Corvettes aren’t necessarily an everyday driver, especially if you live in a wintery state.
A LendingTree study also found that 8.3% of prospective Corvette car buyers were seeking auto loans that exceeded their yearly salaries. Going into a lot of debt for a car isn’t ideal, but on the plus side, it could compel you to put less wear and tear on your ride.
Full rankings: Average annual mileage by car model
| Rank | Car model | Avg. miles/year |
|---|---|---|
| 1 | Chevrolet Malibu | 21,738 |
| 2 | Chevrolet Suburban | 19,315 |
| 3 | Ford Super Duty F-250 SRW | 19,148 |
| 4 | Chevrolet Equinox | 18,938 |
| 5 | Nissan Altima | 18,926 |
| 6 | Kia Soul | 18,830 |
| 7 | Ford Edge | 18,829 |
| 8 | Ford Explorer | 18,650 |
| 9 | Kia Sorento | 18,634 |
| 10 | Toyota Corolla | 18,558 |
| 11 | Kia Sportage | 18,343 |
| 12 | Chevrolet Traverse | 18,334 |
| 13 | Ford Escape | 18,292 |
| 14 | Toyota Camry | 18,202 |
| 15 | Chevrolet Silverado 2500 HD | 18,193 |
| 16 | Ford F-150 | 18,192 |
| 17 | Hyundai Elantra | 18,177 |
| 18 | GMC Terrain | 18,146 |
| 19 | Chevrolet Tahoe | 18,106 |
| 20 | Nissan Pathfinder | 18,039 |
| 21 | Kia K5 | 17,957 |
| 22 | Ram 2500 | 17,885 |
| 23 | GMC Sierra 2500 HD | 17,818 |
| 24 | Chevrolet Silverado 1500 | 17,805 |
| 25 | Hyundai Sonata | 17,769 |
| 26 | Kia Forte | 17,613 |
| 27 | GMC Yukon | 17,475 |
| 28 | Nissan Rogue | 17,467 |
| 29 | GMC Acadia | 17,410 |
| 30 | Jeep Renegade | 17,393 |
| 31 | Nissan Sentra | 17,229 |
| 32 | Jeep Cherokee | 17,223 |
| 33 | Toyota Tacoma 2WD | 17,221 |
| 34 | Honda Accord Sedan | 17,195 |
| 35 | Ford Expedition | 17,073 |
| 36 | Honda Odyssey | 17,070 |
| 37 | Honda Civic Sedan | 16,984 |
| 38 | GMC Sierra 1500 | 16,981 |
| 39 | Hyundai Santa Fe | 16,895 |
| 40 | Chevrolet Camaro | 16,859 |
| 41 | Jeep Wrangler | 16,813 |
| 42 | Toyota Sienna | 16,740 |
| 43 | Chevrolet Colorado | 16,736 |
| 44 | Honda Pilot | 16,613 |
| 45 | Jeep Compass | 16,463 |
| 46 | Toyota Tundra 4WD | 16,225 |
| 47 | Hyundai Tucson | 16,213 |
| 48 | Volkswagen Jetta | 16,193 |
| 49 | Toyota 4Runner | 16,108 |
| 49 | Toyota Highlander | 16,108 |
| 51 | Chevrolet Trax | 16,031 |
| 51 | Kia Telluride | 16,031 |
| 53 | Nissan Frontier | 16,017 |
| 54 | Honda Accord Hybrid | 16,002 |
| 55 | Chrysler Pacifica | 15,987 |
| 56 | Jeep Grand Cherokee | 15,968 |
| 57 | Honda Civic Hatchback | 15,959 |
| 58 | Hyundai Palisade | 15,937 |
| 59 | Ram 1500 | 15,827 |
| 60 | Dodge Durango | 15,784 |
| 61 | Chevrolet Trailblazer | 15,732 |
| 62 | Toyota RAV4 | 15,649 |
| 63 | Dodge Charger | 15,511 |
| 64 | Nissan Kicks | 15,470 |
| 65 | Jeep Grand Cherokee L | 15,435 |
| 66 | Honda CR-V | 15,393 |
| 67 | Toyota Tacoma 4WD | 15,317 |
| 68 | Volkswagen Tiguan | 15,277 |
| 69 | BMW 5 Series | 14,978 |
| 70 | Volkswagen Atlas | 14,938 |
| 71 | Mercedes-Benz C-Class | 14,880 |
| 72 | Hyundai Kona | 14,791 |
| 73 | Chevrolet Blazer | 14,786 |
| 74 | Ford Mustang | 14,752 |
| 75 | Acura MDX | 14,731 |
| 76 | Subaru Outback | 14,707 |
| 77 | Subaru Crosstrek | 14,640 |
| 78 | Subaru Ascent | 14,554 |
| 79 | Honda HR-V | 14,444 |
| 80 | Subaru Forester | 14,443 |
| 81 | Ford Ranger | 14,344 |
| 82 | Tesla Model 3 | 14,187 |
| 83 | Subaru WRX | 14,145 |
| 84 | Lexus RX | 14,026 |
| 85 | Audi Q5 | 14,022 |
| 86 | Mazda CX-5 | 14,019 |
| 87 | BMW 3 Series | 13,904 |
| 88 | Tesla Model Y | 13,845 |
| 89 | Ford Bronco Sport | 13,816 |
| 90 | BMW X5 | 13,790 |
| 91 | Jeep Gladiator | 13,774 |
| 92 | BMW X3 | 13,636 |
| 93 | Dodge Challenger | 13,626 |
| 94 | Acura RDX | 13,617 |
| 95 | Mercedes-Benz GLE | 13,321 |
| 96 | Mercedes-Benz GLC | 13,103 |
| 97 | Lexus NX | 12,704 |
| 98 | Mazda CX-30 | 12,620 |
| 99 | Ford Bronco | 12,384 |
| 100 | Chevrolet Corvette | 11,572 |
Southerners tend to drive the most, compared to the rest of the nation
As a whole, Southern drivers put in more annual miles than pretty much everyone else. Wyoming is an outlier and the only state above the Mason-Dixon to crack the top 10.
States with the highest average annual mileage
At 19,430 average annual miles, Mississippi drivers are on the road more than drivers in any other state. Arkansas and Alabama follow, with 18,656 and 18,292, respectively.
The South and Wyoming are rural and sprawling, which typically means lots of miles between home, work and amenities. Agriculture and forestry are also some of the main industries in these states, which can require more driving than other types of work.
States where people drive the least per year
Drivers in Hawaii put in the fewest miles a year, with an average of 12,977. That’s not much of a surprise when you consider population and population density.
According to the latest Census data, Honolulu is the fifth-most densely populated urban area in the country (out of those with at least 200,000 people). Honolulu is also Hawaii’s largest city and state capital. When everything is conveniently located, there’s not much need for driving.
Alaska and New York come next (13,692 and 13,869). Many of their residents live in cities where most things are centrally located (Anchorage and New York City).
Full rankings: Average miles driven by state
| Rank | State | Avg. miles/year |
|---|---|---|
| 1 | Mississippi | 19,430 |
| 2 | Arkansas | 18,656 |
| 3 | Alabama | 18,292 |
| 4 | Oklahoma | 17,933 |
| 5 | Kentucky | 17,811 |
| 6 | Wyoming | 17,756 |
| 7 | West Virginia | 17,556 |
| 8 | Louisiana | 17,374 |
| 9 | Missouri | 17,272 |
| 10 | Georgia | 17,235 |
| 11 | Tennessee | 17,232 |
| 12 | Indiana | 17,087 |
| 13 | South Carolina | 17,060 |
| 14 | Montana | 17,056 |
| 15 | Texas | 16,967 |
| 16 | New Mexico | 16,857 |
| 17 | Idaho | 16,782 |
| 18 | Kansas | 16,714 |
| 19 | Nevada | 16,671 |
| 20 | North Carolina | 16,648 |
| 21 | Arizona | 16,563 |
| 22 | Wisconsin | 16,354 |
| 23 | Iowa | 16,336 |
| 24 | South Dakota | 16,208 |
| 25 | Virginia | 16,120 |
| 26 | North Dakota | 16,104 |
| 27 | Oregon | 15,994 |
| 28 | Utah | 15,933 |
| 29 | Maryland | 15,826 |
| 30 | Colorado | 15,822 |
| 31 | Nebraska | 15,781 |
| 32 | Delaware | 15,771 |
| 33 | Ohio | 15,682 |
| 34 | Minnesota | 15,639 |
| 35 | Michigan | 15,620 |
| 36 | Maine | 15,537 |
| 37 | Florida | 15,486 |
| 38 | Illinois | 15,289 |
| 39 | California | 15,260 |
| 40 | New Hampshire | 15,214 |
| 41 | Washington | 15,025 |
| 42 | Rhode Island | 14,850 |
| 43 | Vermont | 14,817 |
| 44 | Connecticut | 14,794 |
| 45 | Pennsylvania | 14,565 |
| 46 | Massachusetts | 14,191 |
| 47 | New Jersey | 14,160 |
| 48 | District of Columbia | 13,878 |
| 49 | New York | 13,869 |
| 50 | Alaska | 13,692 |
| 51 | Hawaii | 12,977 |
Land Rovers have the highest odometer readings
If you’re looking for a car that can take a beating, consider a Land Rover (if you can handle that sticker price — the 2024 Range Rover SE starts at a staggering $107,400 MSRP).
We analyzed car insurance inquiries for vehicles with 200,000+ miles on the odometer to see which brands last the longest. Land Rover came out on top, with an average odometer reading of 274,223. The more modestly priced Kia came in second, at 261,687 miles.
Out of this bunch, Hummer and Chrysler had the lowest (yet still impressive) average odometer readings of 228,920 and 230,233.
Full rankings: Average odometer readings for makes driven more than 200,000 miles
| Rank | Make | Avg. odometer reading |
|---|---|---|
| 1 | Land Rover | 274,223 |
| 2 | Kia | 261,687 |
| 3 | Mazda | 257,907 |
| 4 | Mitsubishi | 257,056 |
| 5 | Lincoln | 256,711 |
| 6 | BMW | 254,898 |
| 7 | Jeep | 254,203 |
| 8 | Pontiac | 252,053 |
| 9 | Ford | 250,329 |
| 10 | Mercury | 250,321 |
| 11 | Volkswagen | 250,097 |
| 12 | Nissan | 249,989 |
| 13 | Porsche | 247,645 |
| 14 | Buick | 246,948 |
| 15 | Chevrolet | 246,794 |
| 16 | Audi | 244,767 |
| 17 | Toyota | 244,449 |
| 18 | Acura | 244,047 |
| 19 | Hyundai | 243,633 |
| 20 | Honda | 243,375 |
| 21 | Mercedes-Benz | 242,814 |
| 22 | Dodge | 242,543 |
| 23 | Cadillac | 241,316 |
| 24 | Subaru | 240,068 |
| 25 | Lexus | 238,384 |
| 26 | Ram | 236,733 |
| 27 | GMC | 236,661 |
| 28 | Infiniti | 232,333 |
| 29 | Chrysler | 230,233 |
| 30 | Hummer | 228,920 |
How to leverage your vehicle usage for lower car insurance rates
Does inflation, the price of gas or a change in job situation have you home more often than not? Call your car insurance company — it may have usage-based options that can get you a cheaper rate. Here are some tips from our auto insurance expert, Bhatt, on how to start the conversation.
- Recalculate your commute: Tell your insurance company if you’ve gone remote or hybrid. Insurance companies often use your commute distance to estimate the number of miles you’ll drive each year. If your insurance company has you down at 12,000 miles a year but you actually drive 4,000, you could see savings. The less you drive, the lower your risk.
- Ask about pay-per-mile insurance: A pay-per-mile insurance plan is another way for low-mileage drivers to save money. Your rate is based on the total number of miles you drive, either annually or each month, depending on the company. Allstate, Nationwide and Lemonade offer some form of pay-per-mile insurance in select states.
- Look for low-mileage discounts: If you’re driving less than you used to, find out if your current insurance company can give you a low-mileage discount. If not, get quotes from a company that can.
Bhatt also says that regardless of how much you drive, it’s always good to shop around to see if you can get a cheaper rate from another company. Unfortunately, insurance rates have been on the rise in most parts of the country. Getting quotes from a few different companies is a good way to make sure you’re getting the best available deal.
Methodology
LendingTree researchers analyzed 1 million-plus completed auto loan inquiries for passenger vehicles on the LendingTree platform in 2024 to determine the makes, models and states with the highest average mileage per year.
Vehicles included in the main analysis are those with a model year from 2019 to 2023 and mileage between 5,000 and 300,000. The rankings included the 30 vehicle makes and 100 vehicle models with the highest number of inquiries in 2024.
To calculate makes’, models’ and states’ average mileage per year, a vehicle’s total mileage was divided by the difference between 2024 and the vehicle’s model year.
Additionally, the average mileage among those making inquiries with mileage between 200,000 and 500,000 was calculated. We limited this to the 30 vehicle makes with the highest number of inquiries.