Red, Blue and Purple: Whether Republican, Democratic or Swing States Pay More for Home and Auto Insurance


Insurance is heavily debated in politics, and state commissioners may regulate insurance differently depending on their political leaning.
But neither major political party bests the other across the board. According to the latest LendingTree analysis, policyholders in Republican states pay far more on average for home insurance, while policyholders in Democratic states pay more on average for auto insurance. (And that’s without accounting for swing states, which we’ll also discuss here.)
Here’s what else we found.
Key findings
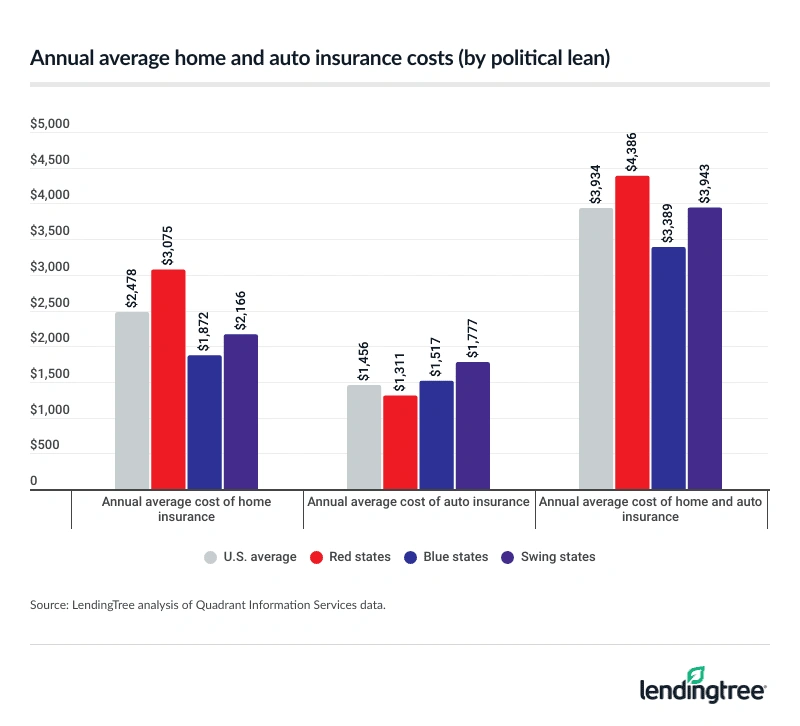
- Annual average home insurance costs in red states are $909 higher than in swing states and $1,203 higher than in blue states. Policyholders in red Republican-leaning states pay an average of $3,075 a year for home insurance, ahead of $2,166 in purple swing states and $1,872 in blue Democratic-leaning states.
- Nine of the 10 states with the highest annual average home insurance rates lean red. Three red states — Oklahoma ($5,478), Nebraska ($5,363) and Kansas ($4,825) — lead, with the highest-ranking blue state — Colorado ($4,042) — in sixth.
- Meanwhile, swing states pay the highest annual average auto insurance costs — $260 more than in blue states and $466 more than in red states. Policyholders in swing states pay an average of $1,777 annually for auto insurance, ahead of $1,517 in blue states and $1,311 in red states.
- The majority of the states with the highest annual average auto insurance rates lean blue. Six of the 10 states with the highest auto rates are blue, while two are red and two are swing states. Swing states Michigan ($3,814, in first) and Nevada ($2,371, in third) are joined by red state Florida ($2,488, in second) at the top.
- Between 2023 and 2024, six of the 10 states with the highest cumulative home insurance rate increases leaned red, while six of the 10 with the highest cumulative auto insurance rate increases leaned blue. For home insurance, red state Utah (39.9%), red state Nebraska (38.2%) and swing state Arizona (37.5%) led. For auto insurance, swing state Nevada (40.4%), blue state Washington (38.8%) and blue state New York (31.4%) led.
LendingTree researchers utilized 2024 Cook Political Report Electoral College Rating data.
Researchers labeled each state red (Republican) or blue (Democratic) if it leaned in either direction, while a state was considered a “swing state” (purple) if it was labeled a toss-up:
Red states
- Alabama
- Alaska
- Arkansas
- Florida
- Idaho
- Indiana
- Iowa
- Kansas
- Kentucky
- Louisiana
- Mississippi
- Missouri
- Montana
- Nebraska
- North Dakota
- Ohio
- Oklahoma
- South Carolina
- South Dakota
- Tennessee
- Texas
- Utah
- West Virginia
- Wyoming
Blue states
- California
- Colorado
- Connecticut
- Delaware
- District of Columbia
- Hawaii
- Illinois
- Maine
- Maryland
- Massachusetts
- Minnesota
- New Hampshire
- New Jersey
- New Mexico
- New York
- Oregon
- Rhode Island
- Vermont
- Virginia
- Washington
Swing states
- Arizona
- Georgia
- Michigan
- Nevada
- North Carolina
- Pennsylvania
- Wisconsin
Red states pay more on average for home insurance
Policyholders in red states shell out the most for home insurance. On average, those in Republican-leaning states pay $3,075 a year for home insurance — significantly higher than the $2,166 those in swing states and $1,872 those in blue Democratic states pay.
Breaking that down further, nine of the 10 states with the highest annual average home insurance rates lean red. Oklahoma leads, with policyholders paying $5,478 a year on average. That’s followed by Nebraska ($5,363) and Kansas ($4,825).
While politicians control the regulatory climate in their states, insurance expert and licensed insurance agent Rob Bhatt says they don’t control the actual climate, which plays the biggest role in rate setting.
“The states with the highest home insurance rates are the ones that have been hit hardest by climate-related disasters in recent years,” he says. “These disasters have increased the amounts insurance companies have had to pay to rebuild homes. Insurance companies have been trying to keep up with these spiraling costs with higher rates.”
The states with the highest home insurance rates are the ones that have been hit hardest by climate-related disasters in recent years.

Oklahoma sees an average of 66 tornadoes a year, according to The Weather Channel — and with high risk comes high rates. Similarly, Nebraska sees 45 tornadoes a year on average, while Kansas sees an average of 87.
Colorado is the only blue state in the top 10. With policyholders here paying $4,042 a year on average, it ranks sixth.
States with the highest annual average cost of home insurance
| Rank | State | State lean | Annual avg. cost of home insurance |
|---|---|---|---|
| 1 | Oklahoma | Red | $5,478 |
| 2 | Nebraska | Red | $5,363 |
| 3 | Kansas | Red | $4,825 |
| 4 | Texas | Red | $4,647 |
| 5 | Kentucky | Red | $4,080 |
| 6 | Colorado | Blue | $4,042 |
| 7 | Mississippi | Red | $3,677 |
| 8 | Louisiana | Red | $3,510 |
| 9 | Florida | Red | $3,425 |
| 10 | Arkansas | Red | $3,357 |
Climate change certainly impacts home insurance rates. It’s worth noting that just one of the red-leaning states in the top 10 (Florida) has made recent progress on climate action, according to data from Climate XChange. This makes sense since it’s the most vulnerable to climate impacts, according to SafeHome.org.
Conversely, seven of the 10 states with the lowest home insurance premiums lean Democratic, with policyholders in Hawaii ($549) paying the least annually. That’s below New Hampshire ($1,096) and California ($1,121).
Full rankings: Annual average cost of home insurance (by state)
| Rank | State | State lean | Annual avg. cost of home insurance |
|---|---|---|---|
| 1 | Oklahoma | Red | $5,478 |
| 2 | Nebraska | Red | $5,363 |
| 3 | Kansas | Red | $4,825 |
| 4 | Texas | Red | $4,647 |
| 5 | Kentucky | Red | $4,080 |
| 6 | Colorado | Blue | $4,042 |
| 7 | Mississippi | Red | $3,677 |
| 8 | Louisiana | Red | $3,510 |
| 9 | Florida | Red | $3,425 |
| 10 | Arkansas | Red | $3,357 |
| 11 | Minnesota | Blue | $3,217 |
| 12 | South Dakota | Red | $3,208 |
| 13 | Missouri | Red | $3,035 |
| 14 | North Carolina | Swing | $3,033 |
| 15 | New Mexico | Blue | $3,022 |
| 16 | South Carolina | Red | $2,952 |
| 17 | Alabama | Red | $2,881 |
| 18 | Montana | Red | $2,774 |
| 19 | North Dakota | Red | $2,580 |
| 20 | Tennessee | Red | $2,570 |
| 21 | Georgia | Swing | $2,553 |
| 22 | Illinois | Blue | $2,472 |
| 23 | Iowa | Red | $2,439 |
| 24 | Indiana | Red | $2,386 |
| 25 | Arizona | Swing | $2,345 |
| 26 | Connecticut | Blue | $2,342 |
| 27 | West Virginia | Red | $2,244 |
| 28 | Virginia | Blue | $2,241 |
| 29 | Michigan | Swing | $2,146 |
| 30 | Wyoming | Red | $2,043 |
| 31 | Rhode Island | Blue | $2,034 |
| 32 | Idaho | Red | $1,947 |
| 33 | Wisconsin | Swing | $1,912 |
| 34 | New York | Blue | $1,806 |
| 35 | Pennsylvania | Swing | $1,730 |
| 36 | Massachusetts | Blue | $1,727 |
| 37 | Ohio | Red | $1,690 |
| 38 | Oregon | Blue | $1,678 |
| 39 | Maine | Blue | $1,658 |
| 40 | Maryland | Blue | $1,598 |
| 41 | District of Columbia | Blue | $1,563 |
| 42 | New Jersey | Blue | $1,533 |
| 43 | Nevada | Swing | $1,444 |
| 44 | Washington | Blue | $1,405 |
| 45 | Utah | Red | $1,350 |
| 46 | Alaska | Red | $1,327 |
| 47 | Vermont | Blue | $1,191 |
| 48 | Delaware | Blue | $1,136 |
| 49 | California | Blue | $1,121 |
| 50 | New Hampshire | Blue | $1,096 |
| 51 | Hawaii | Blue | $549 |
Swing states pay higher average auto insurance premiums, but blue states dominate top-10 list
As for auto insurance, policyholders in the seven swing states pay the highest rates on average. While those in swing states pay an average of $1,777 annually for auto insurance, those in blue states pay $1,517 and those in red states pay $1,311.
While each state sets auto insurance laws, most require minimum car insurance with liability coverage limits of at least $25,000 for injuries per person and $50,000 per accident.
While swing states pay the most on average, six of the 10 states with the highest auto insurance rates are blue. Meanwhile, two are red and two are swing states.
Michigan (a swing state) ranks first, with policyholders paying $3,814 annually on average. Florida (a red state) follows, at $2,488. Finally, swing state Nevada ($2,371) rounds out the top three.
State requirements likely affect rankings the most. Four of the 10 most expensive states for car insurance have no-fault auto insurance requirements. Additionally, Michigan has a higher bodily injury (BI) coverage requirement, at $50,000 per person and $100,000 per accident. While Florida has some of the most lax requirements by state, the high risk of storm or flood damage likely leads to higher premiums there.
States with the highest annual average cost of auto insurance
| Rank | State | State lean | Annual avg. cost of auto insurance |
|---|---|---|---|
| 1 | Michigan | Swing | $3,814 |
| 2 | Florida | Red | $2,488 |
| 3 | Nevada | Swing | $2,371 |
| 4 | Louisiana | Red | $2,363 |
| 5 | Rhode Island | Blue | $2,270 |
| 6 | Oregon | Blue | $2,216 |
| 7 | New York | Blue | $2,203 |
| 8 | Connecticut | Blue | $1,964 |
| 9 | Delaware | Blue | $1,961 |
| 10 | Massachusetts | Blue | $1,785 |
Additionally, Bhatt says red states tend to be rural, and rural areas tend to have lower car insurance rates. In contrast, blue and swing states tend to have a higher concentration of populations around big cities.
“Urban and suburban areas tend to have higher crash and car theft rates,” he says. “Medical treatment and car repairs also tend to cost more in these areas. These are factors that impact insurance companies’ costs. Insurance companies protect themselves from these costs by charging more in areas where they have higher expenses, like population centers.”
Decision 2024: Where U.S. presidential candidates stand on housing issues
Meanwhile, five of the bottom 10 states are red, three are blue and two are swing states. Democrat-leaning Vermont ranks lowest, with annual auto insurance premiums at $714 on average. Red state Idaho ($768) follows, with blue state Maine ($771) rounding out the bottom three.
Full rankings: Annual average cost of auto insurance (by state)
| Rank | State | State lean | Annual avg. cost of auto insurance |
|---|---|---|---|
| 1 | Michigan | Swing | $3,814 |
| 2 | Florida | Red | $2,488 |
| 3 | Nevada | Swing | $2,371 |
| 4 | Louisiana | Red | $2,363 |
| 5 | Rhode Island | Blue | $2,270 |
| 6 | Oregon | Blue | $2,216 |
| 7 | New York | Blue | $2,203 |
| 8 | Connecticut | Blue | $1,964 |
| 9 | Delaware | Blue | $1,961 |
| 10 | Massachusetts | Blue | $1,785 |
| 11 | Colorado | Blue | $1,779 |
| 12 | Maryland | Blue | $1,724 |
| 13 | New Jersey | Blue | $1,687 |
| 14 | Kentucky | Red | $1,659 |
| 15 | Arizona | Swing | $1,614 |
| 16 | Alabama | Red | $1,536 |
| 17 | South Carolina | Red | $1,529 |
| 18 | Oklahoma | Red | $1,501 |
| 19 | Georgia | Swing | $1,494 |
| 20 | Washington | Blue | $1,459 |
| 21 | Missouri | Red | $1,455 |
| 22 | Pennsylvania | Swing | $1,453 |
| 23 | Texas | Red | $1,425 |
| 24 | Illinois | Blue | $1,381 |
| 25 | Ohio | Red | $1,380 |
| 26 | Utah | Red | $1,366 |
| 27 | California | Blue | $1,357 |
| 28 | New Mexico | Blue | $1,338 |
| 29 | District of Columbia | Blue | $1,305 |
| 30 | Alaska | Red | $1,279 |
| 31 | Montana | Red | $1,273 |
| 32 | Minnesota | Blue | $1,270 |
| 33 | Nebraska | Red | $1,198 |
| 34 | Hawaii | Blue | $1,192 |
| 35 | West Virginia | Red | $1,162 |
| 36 | Mississippi | Red | $1,145 |
| 37 | Virginia | Blue | $1,131 |
| 38 | North Dakota | Red | $1,091 |
| 39 | Arkansas | Red | $1,073 |
| 40 | Kansas | Red | $1,050 |
| 41 | Wyoming | Red | $1,020 |
| 42 | Tennessee | Red | $969 |
| 43 | Indiana | Red | $953 |
| 44 | Iowa | Red | $929 |
| 45 | Wisconsin | Swing | $886 |
| 46 | South Dakota | Red | $860 |
| 47 | New Hampshire | Blue | $831 |
| 48 | North Carolina | Swing | $805 |
| 49 | Maine | Blue | $771 |
| 50 | Idaho | Red | $768 |
| 51 | Vermont | Blue | $714 |
Where home, auto insurance rates increased the most
Turning to rate increases, red states dominated the list for home insurance rate spikes, while blue states dominated the list for auto insurance rate spikes. Specifically, six of the 10 states with the highest cumulative home insurance rate increases between 2023 and 2024 were red, while six of the 10 with the highest cumulative auto insurance rate increases were blue.

Utah had the largest home insurance spike, with premiums in this red state increasing by 39.9% between 2023 and 2024. Fellow red state Nebraska (38.2%) and swing state Arizona (37.5%) followed. Natural disaster risk is largely to blame: Utah and Arizona have a high number of homes at risk for extreme wildfires, while Nebraska has the aforementioned risk of tornadoes.
Cumulative increase in home insurance rates, 2023-24
| Rank | State | State lean | Increase in home insurance rates, 2023-24 |
|---|---|---|---|
| 1 | Utah | Red | 39.9% |
| 2 | Nebraska | Red | 38.2% |
| 3 | Arizona | Swing | 37.5% |
| 4 | Iowa | Red | 35.5% |
| 5 | Illinois | Blue | 34.7% |
| 6 | Washington | Blue | 34.2% |
| 7 | Minnesota | Blue | 31.2% |
| 8 | Montana | Red | 30.2% |
| 9 | South Dakota | Red | 29.7% |
| 10 | Arkansas | Red | 28.9% |
Meanwhile, blue state Vermont (6.5%) had the smallest increase, followed by swing state Nevada (10.2%) and blue state New York (10.8%).
Turning to the states with the highest auto insurance spikes, swing state Nevada led, with a 40.4% increase in premiums between 2023 and 2024. Blue states Washington (38.8%) and New York (31.4%) followed.
Cumulative increase in auto insurance rates, 2023-24
| Rank | State | State lean | Increase in auto insurance rates, 2023-24 |
|---|---|---|---|
| 1 | Nevada | Swing | 40.4% |
| 2 | Washington | Blue | 38.8% |
| 3 | New York | Blue | 31.4% |
| 4 | California | Blue | 30.3% |
| 5 | New Jersey | Blue | 29.0% |
| 6 | Connecticut | Blue | 28.9% |
| 7 | Minnesota | Blue | 26.8% |
| 8 | Nebraska | Red | 26.0% |
| 9 | Michigan | Swing | 25.1% |
| 10 | South Carolina | Red | 25.0% |
Conversely, blue state Hawaii (8.5%), swing state North Carolina (10.5%) and blue state New Mexico (15.1%) had the lowest auto insurance increases.
While Bhatt says inflation plays a significant role in both home and auto insurance increases, he says consumers shouldn’t feel discouraged.
“Fortunately, there are signs that insurance rates are beginning to stabilize,” he says. “Inflation has cooled. We’ve seen fewer catastrophic weather events this year. Car crash rates are returning to prepandemic norms. There are several reasons to feel good about each of these trends. Insurance price stability is one of them.”
Full rankings: Cumulative increase in home insurance rates, 2023-24
| Rank | State | State lean | Increase in home insurance rates, 2023-24 |
|---|---|---|---|
| 1 | Utah | Red | 39.9% |
| 2 | Nebraska | Red | 38.2% |
| 3 | Arizona | Swing | 37.5% |
| 4 | Iowa | Red | 35.5% |
| 5 | Illinois | Blue | 34.7% |
| 6 | Washington | Blue | 34.2% |
| 7 | Minnesota | Blue | 31.2% |
| 8 | Montana | Red | 30.2% |
| 9 | South Dakota | Red | 29.7% |
| 10 | Arkansas | Red | 28.9% |
| 11 | Idaho | Red | 28.5% |
| 12 | Colorado | Blue | 27.3% |
| 13 | Texas | Red | 26.9% |
| 14 | Wisconsin | Swing | 26.6% |
| 15 | Oregon | Blue | 26.3% |
| 16 | New Mexico | Blue | 25.2% |
| 17 | Indiana | Red | 24.9% |
| 18 | Oklahoma | Red | 24.7% |
| 19 | California | Blue | 24.4% |
| 20 | Missouri | Red | 24.3% |
| 21 | North Dakota | Red | 23.8% |
| 22 | Kentucky | Red | 23.2% |
| 23 | Connecticut | Blue | 22.7% |
| 24 | Kansas | Red | 22.3% |
| 25 | Ohio | Red | 22.1% |
| 26 | Louisiana | Red | 21.3% |
| 27 | Rhode Island | Blue | 20.9% |
| 27 | Tennessee | Red | 20.9% |
| 29 | Alabama | Red | 20.6% |
| 29 | Virginia | Blue | 20.6% |
| 31 | Maryland | Blue | 20.1% |
| 31 | Pennsylvania | Swing | 20.1% |
| 33 | Michigan | Swing | 19.2% |
| 34 | Massachusetts | Blue | 16.9% |
| 34 | New Hampshire | Blue | 16.9% |
| 36 | North Carolina | Swing | 16.8% |
| 37 | Mississippi | Red | 16.4% |
| 38 | Georgia | Swing | 16.0% |
| 39 | West Virginia | Red | 15.6% |
| 40 | Florida | Red | 13.8% |
| 40 | Maine | Blue | 13.8% |
| 42 | South Carolina | Red | 13.6% |
| 43 | New Jersey | Blue | 13.5% |
| 44 | Hawaii | Blue | 13.4% |
| 45 | Alaska | Red | 12.7% |
| 46 | Delaware | Blue | 11.8% |
| 47 | District of Columbia | Blue | 11.2% |
| 48 | New York | Blue | 10.8% |
| 49 | Nevada | Swing | 10.2% |
| 50 | Vermont | Blue | 6.5% |
Full rankings: Cumulative increase in auto insurance rates, 2023-24
| Rank | State | State lean | Increase in auto insurance rates, 2023-24 |
|---|---|---|---|
| 1 | Nevada | Swing | 40.4% |
| 2 | Washington | Blue | 38.8% |
| 3 | New York | Blue | 31.4% |
| 4 | California | Blue | 30.3% |
| 5 | New Jersey | Blue | 29.0% |
| 6 | Connecticut | Blue | 28.9% |
| 7 | Minnesota | Blue | 26.8% |
| 8 | Nebraska | Red | 26.0% |
| 9 | Michigan | Swing | 25.1% |
| 10 | South Carolina | Red | 25.0% |
| 11 | Arkansas | Red | 24.8% |
| 12 | Maryland | Blue | 24.7% |
| 13 | Louisiana | Red | 24.2% |
| 14 | Delaware | Blue | 23.7% |
| 15 | Ohio | Red | 23.5% |
| 15 | Pennsylvania | Swing | 23.5% |
| 17 | Utah | Red | 23.1% |
| 18 | West Virginia | Red | 23.0% |
| 19 | Illinois | Blue | 22.7% |
| 19 | Maine | Blue | 22.7% |
| 19 | Tennessee | Red | 22.7% |
| 19 | Virginia | Blue | 22.7% |
| 23 | District of Columbia | Blue | 22.3% |
| 24 | South Dakota | Red | 22.1% |
| 25 | Florida | Red | 22.0% |
| 26 | Arizona | Swing | 21.8% |
| 26 | Georgia | Swing | 21.8% |
| 26 | Mississippi | Red | 21.8% |
| 29 | Kentucky | Red | 21.7% |
| 30 | Iowa | Red | 21.2% |
| 31 | North Dakota | Red | 20.9% |
| 32 | Indiana | Red | 20.8% |
| 32 | Oklahoma | Red | 20.8% |
| 34 | Wisconsin | Swing | 20.7% |
| 35 | Oregon | Blue | 20.6% |
| 36 | Texas | Red | 20.0% |
| 37 | Kansas | Red | 19.9% |
| 38 | Massachusetts | Blue | 19.3% |
| 39 | Missouri | Red | 19.1% |
| 40 | Vermont | Blue | 18.7% |
| 41 | New Hampshire | Blue | 18.1% |
| 42 | Colorado | Blue | 17.9% |
| 43 | Alabama | Red | 17.2% |
| 44 | Rhode Island | Blue | 17.0% |
| 45 | Montana | Red | 16.7% |
| 46 | Idaho | Red | 16.2% |
| 47 | Alaska | Red | 15.9% |
| 48 | New Mexico | Blue | 15.1% |
| 49 | North Carolina | Swing | 10.5% |
| 50 | Hawaii | Blue | 8.5% |
Handling high rates: Top expert tips
Regardless of where you live or your political affiliation, high insurance rates are an increasing pain.
“Now more than ever, it’s important to shop around,” Bhatt says. “Insurance companies have raised their rates by varying amounts from state to state over the past few years. Your current company may not be the cheapest option anymore. Comparing rates from multiple companies is a good way to avoid overpaying.”
Particularly, he recommends:
- Choose a higher deductible. Doing so will lower your monthly premium, but be prepared to take on more of the repair costs if you need to file a claim.
- Bundle your home and auto insurance with the same company. “If you need insurance for anything else, like a boat, motorcycle or rental property, add that to your bundle, too,” Bhatt says.
- Pay for your policies in full up front, when possible. “You usually get a small discount or avoid fees when you pay in advance,” he says. “If you can’t do that, see if you can get a discount for setting up autopay.” Be sure to ask your insurance agent if there are any other additional discounts you may be eligible to receive.
Methodology
LendingTree researchers analyzed home insurance data from Quadrant Information Services. These rates were publicly sourced from insurer filings and should be used for comparative purposes only. Your quotes will likely differ. The following coverages and deductibles were used unless otherwise noted:
- $350,000 dwelling coverage
- $35,000 other structures
- $175,000 personal property
- $70,000 loss of use coverage
- $100,000 liability
- $5,000 medical payments
- $1,000 deductible
Additionally, auto insurance rate data from Quadrant Information Services was also analyzed. These rates reflect the average of premiums available for minimum- and full-coverage policies for a 35-year-old male driver with a clean record. Minimum-coverage policies meet each state’s minimum requirements for liability insurance. Uninsured-motorist coverage and/or personal injury protection (PIP) are included in states where these coverages are required. Full-coverage policies include the following coverages, limits and deductibles:
- Bodily injury liability: $100,000 per person and $300,000 per accident
- Property damage liability: $100,000
- Collision: $500 deductible
- Comprehensive: $500 deductible
- Uninsured motorist: Minimum limits where required
- Personal injury protection: Minimum limits where required
Home and auto insurance rate change data was compiled using RateWatch from S&P Global, which uses annual information from the National Association of Insurance Commissioners (NAIC).
Finally, states were defined as red (Republican-leaning), blue (Democratic-leaning) or purple swing states using the 2024 Cook Political Report (CPR) Electoral College Ratings. Red or blue states were labeled based on their partisan lean via CPR data. Swing states are toss-ups: Arizona, Georgia, Michigan, Nevada, North Carolina, Pennsylvania and Wisconsin.