Minneapolis, Gen Z and Infiniti Drivers Most Prone to Speeding — Here’s a Breakdown in 50 Largest US Cities


Going a few extra miles per hour may seem innocent enough at first, but it can turn into a dangerous habit over time. Issues stemming from speeding show up most clearly in Minneapolis, according to LendingTree research: Drivers in the city record 7.5 speeding-related incidents per 1,000 drivers, the highest rate in any of the 50 largest U.S. cities.
Of course, Minneapolis has plenty of company at the top of the list, and speeding patterns extend far beyond geography. The data also reveals clear generational differences and trends across different car brands. Gen Z drivers stand out with speeding incident rates that double those of millennials. And the incident rates of Infiniti drivers exceed all other major car makes. Speed also plays a major role in fatal crashes in several major U.S. cities.
Key findings
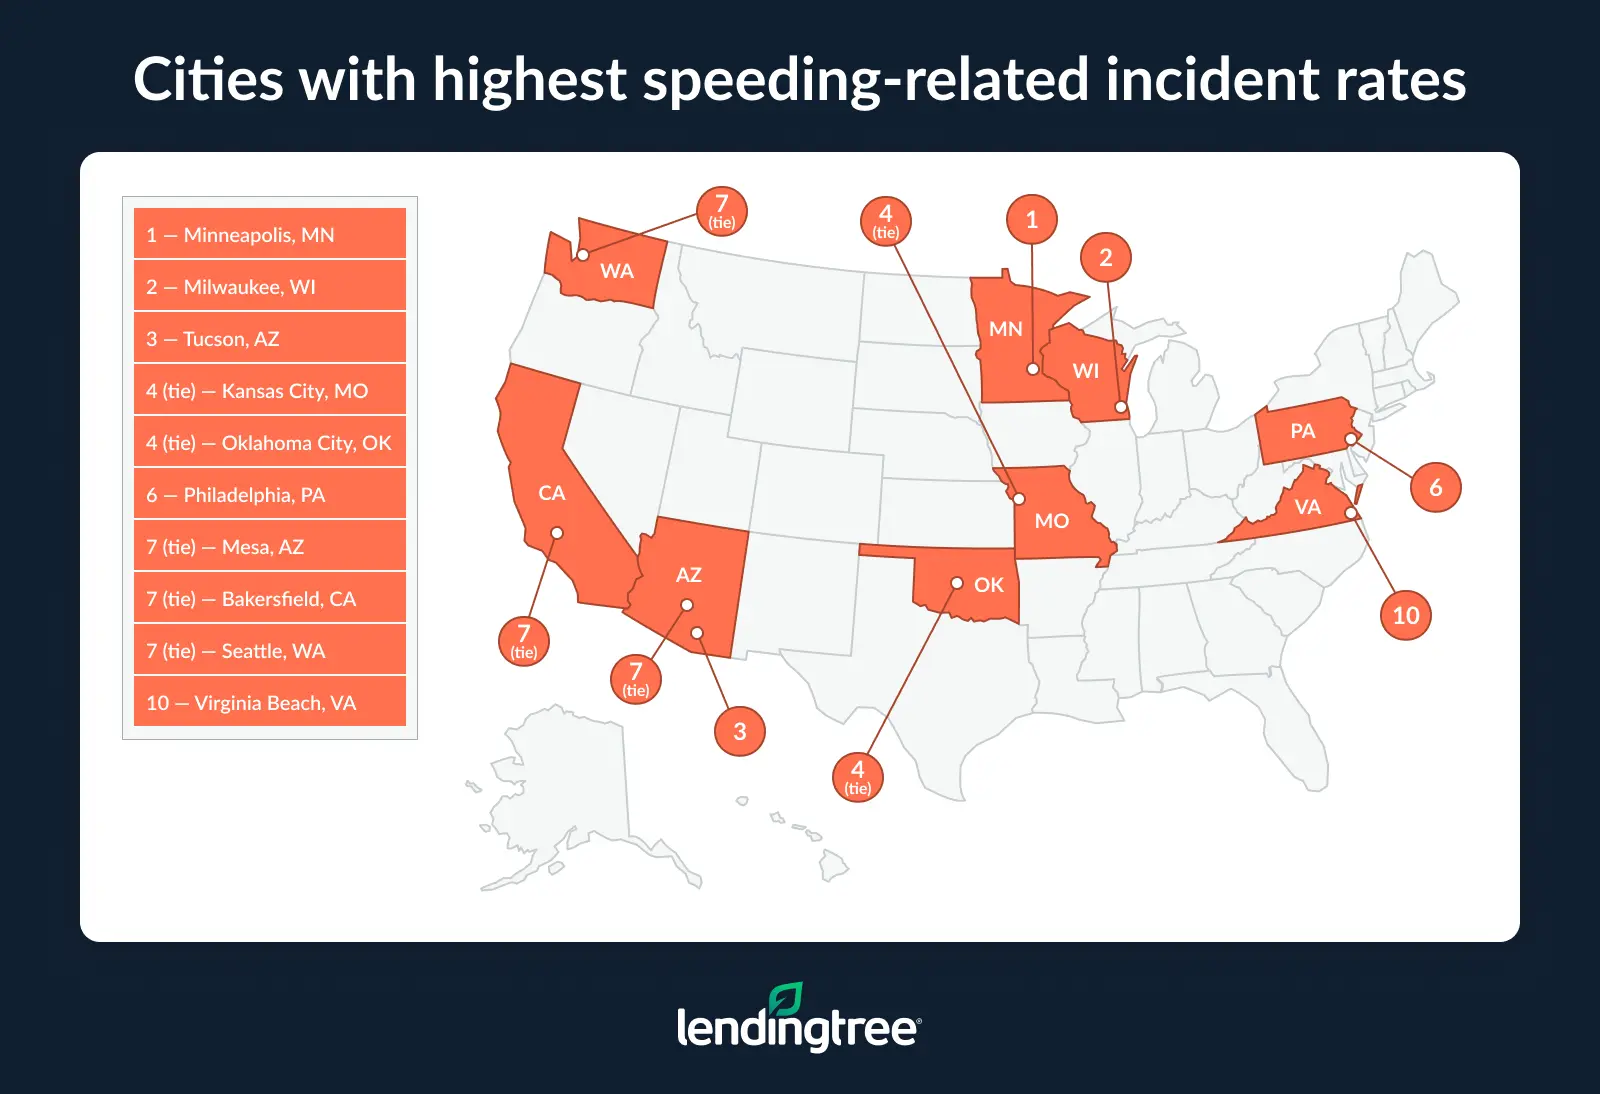
- Drivers in Minneapolis, Milwaukee and Tucson, Ariz., have the highest speeding-related incident rates among the 50 biggest U.S. cities. In these cities, drivers register 7.5, 7.4 and 6.6 incidents, respectively, per 1,000 drivers.
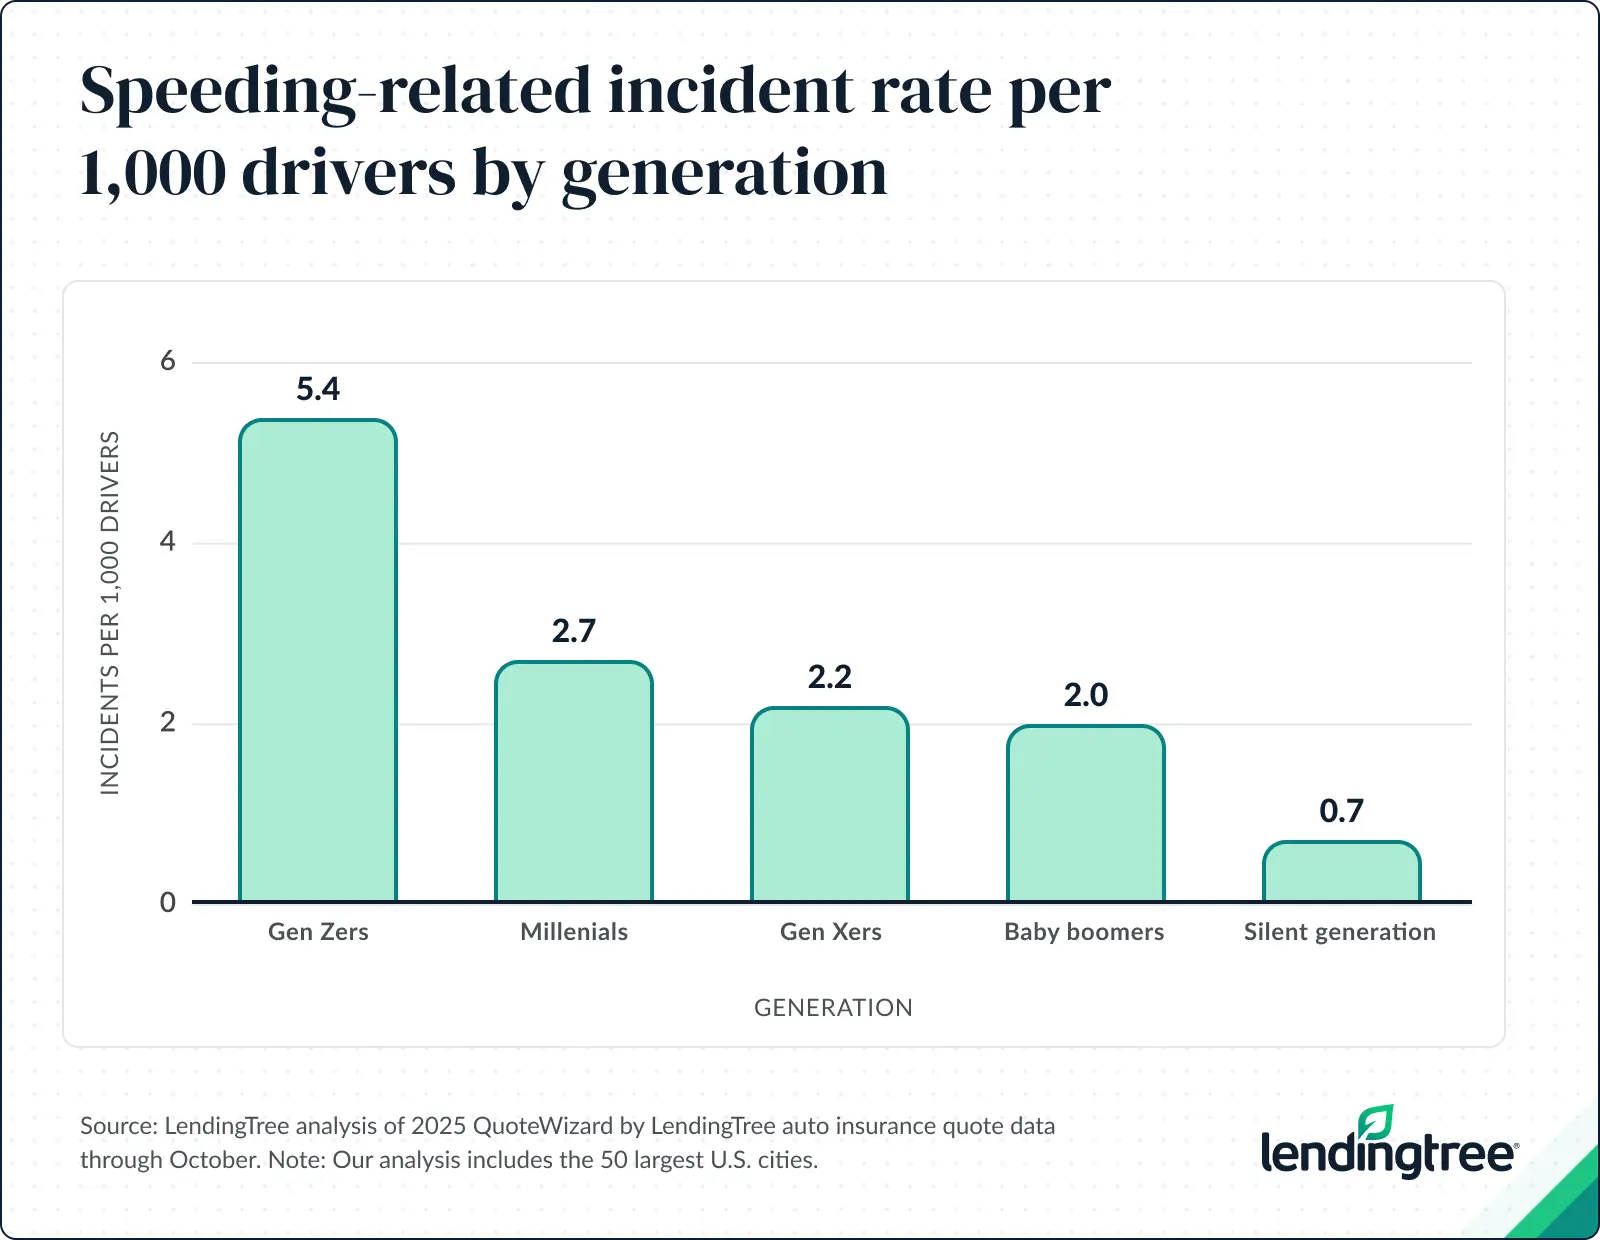
- Gen Z drivers stand out by a wide margin, logging double the incident rate of the next highest generation. In the 50 largest cities, Gen Z drivers average 5.4 speeding incidents per 1,000 drivers, versus 2.7 for millennial drivers.
- Incident rates are fairly consistent across the car makes analyzed. Infiniti leads at 3.5 speeding incidents per 1,000 drivers. But even the brands with lower rates of incidents — Chrysler, Land Rover, Lexus and Cadillac — aren’t far behind, at 2.2 each.
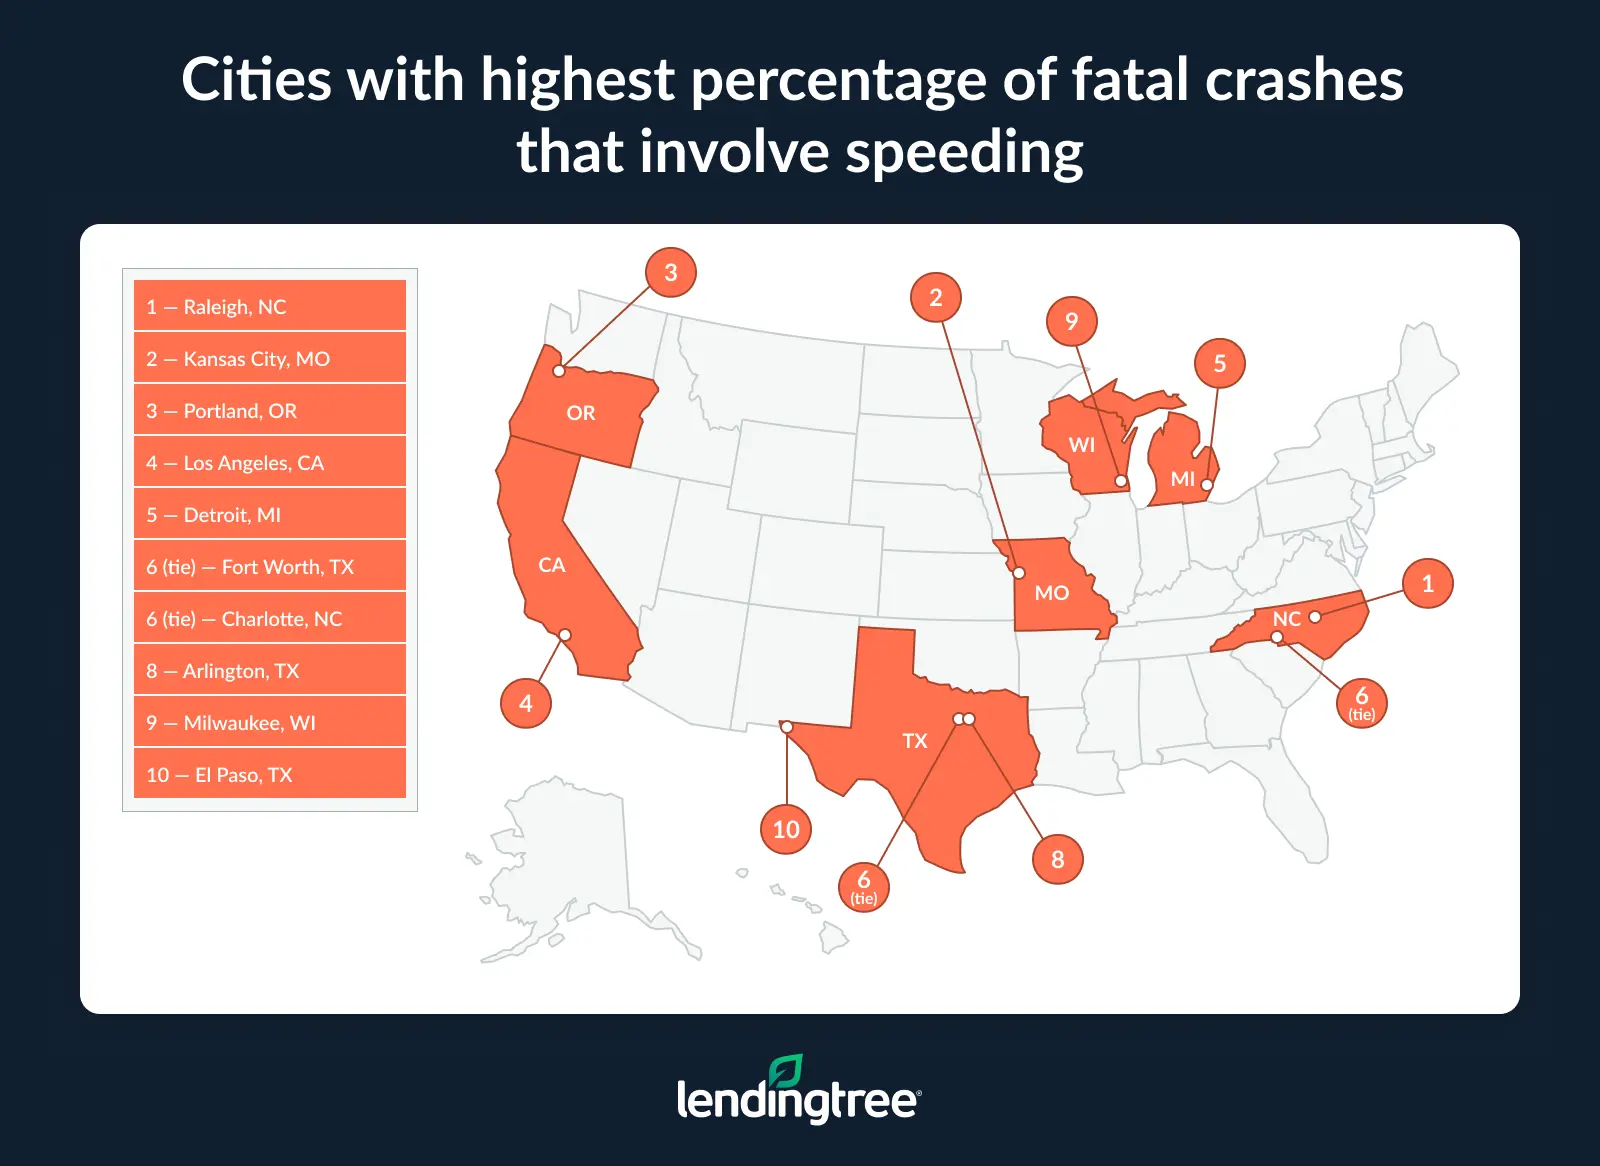
- Raleigh, N.C., outpaces all major cities in speeding-related fatal accidents. 60.5% of fatal crashes in the city involve speeding. Another North Carolina city, Charlotte, joins Raleigh in the top 10, with speeding playing a role in 41.7% of fatal crashes. Additionally, Texas has three cities in the top 10: Fort Worth (41.7%), Arlington (41.5%) and El Paso (40.5%).
Minneapolis has highest speeding-related incident rate
LendingTree examined speeding in the 50 largest U.S. cities by population. Among that list, Minneapolis drivers recorded the highest number of speeding-related incidents, with 7.5 per 1,000 drivers. Milwaukee follows at 7.4, and Tucson, Ariz., ranks third at 6.6.
These high rates raise the question of why speeding appears more common in these areas. Several factors likely play a role: Traffic patterns, weather and commuting habits can all influence driving behavior.
How does exceeding the speed limit affect insurance costs? Rob Bhatt, LendingTree auto insurance expert and licensed insurance agent, explains that speeding tickets don’t increase a city’s insurance rates the way accidents do, which is good news for people who live in places with high speeding rates.
“If you get a speeding ticket, you’re likely to see your rates go up for a few years,” Bhatt says. “However, speeding itself doesn’t impact an insurance company’s costs. Accidents, on the other hand, cost insurance companies money in the form of claims payments.”
Meanwhile, cities with lower speeding incident rates show a very different pattern:
- Boston ranks last on the list with 0.5 incidents per 1,000 drivers. This marks the second consecutive year that Beantown has made the list of big cities with the fewest speeding incidents. According to traffic data company Inrix, Boston is the sixth-most congested city in North and South America, with drivers losing 83 hours a year to traffic delays.
- San Francisco sits near the bottom of the list, with 0.8 incidents per 1,000 drivers.
- Another California city, San Diego, also records 0.8 incidents per 1,000 drivers.
Notably, all three cities with the fewest speeding incidents tend to have dense urban centers and frequent congestion. Slower traffic often reduces opportunities for driving at higher speeds.
Full rankings: Cities with highest speeding-related incident rates
| Rank | City | Speeding-related incident rate per 1,000 drivers |
|---|---|---|
| 1 | Minneapolis, MN | 7.5 |
| 2 | Milwaukee, WI | 7.4 |
| 3 | Tucson, AZ | 6.6 |
| 4 | Kansas City, MO | 6.0 |
| 4 | Oklahoma City, OK | 6.0 |
| 6 | Philadelphia, PA | 5.4 |
| 7 | Mesa, AZ | 5.2 |
| 7 | Bakersfield, CA | 5.2 |
| 7 | Seattle, WA | 5.2 |
| 10 | Virginia Beach, VA | 5.0 |
| 11 | Memphis, TN | 4.8 |
| 11 | Indianapolis, IN | 4.8 |
| 13 | Omaha, NE | 4.5 |
| 14 | Albuquerque, NM | 4.4 |
| 15 | Baltimore, MD | 4.2 |
| 15 | Atlanta, GA | 4.2 |
| 17 | Nashville, TN | 4.0 |
| 18 | Colorado Springs, CO | 3.9 |
| 18 | Raleigh, NC | 3.9 |
| 20 | Portland, OR | 3.8 |
| 21 | Phoenix, AZ | 3.7 |
| 22 | Columbus, OH | 3.6 |
| 23 | Denver, CO | 3.2 |
| 24 | Detroit, MI | 3.0 |
| 25 | Charlotte, NC | 2.9 |
| 26 | Houston, TX | 2.8 |
| 26 | Fresno, CA | 2.8 |
| 28 | San Antonio, TX | 2.6 |
| 29 | Louisville, KY | 2.4 |
| 29 | San Jose, CA | 2.4 |
| 31 | Miami, FL | 2.3 |
| 32 | Austin, TX | 2.2 |
| 32 | Tulsa, OK | 2.2 |
| 32 | Chicago, IL | 2.2 |
| 35 | Jacksonville, FL | 1.9 |
| 35 | Dallas, TX | 1.9 |
| 37 | Washington, DC | 1.8 |
| 38 | Las Vegas, NV | 1.6 |
| 38 | El Paso, TX | 1.6 |
| 40 | Tampa, FL | 1.5 |
| 40 | Los Angeles, CA | 1.5 |
| 42 | Fort Worth, TX | 1.4 |
| 43 | Sacramento, CA | 1.3 |
| 43 | New York, NY | 1.3 |
| 45 | Arlington, TX | 1.1 |
| 46 | Long Beach, CA | 0.9 |
| 46 | Oakland, CA | 0.9 |
| 48 | San Diego, CA | 0.8 |
| 48 | San Francisco, CA | 0.8 |
| 50 | Boston, MA | 0.5 |
Young drivers have highest incident rates
Gen Z drivers lead every age group when it comes to speeding incidents, with 5.4 per 1,000 drivers in the 50 largest cities. This figure is double the rate of millennials, who record 2.7 speeding incidents per 1,000 drivers. Rates among Generation Xers (2.2) and baby boomers (2.0) are even lower.
For reference, LendingTree defines generations using Pew Research Center guidelines:
- Gen Zers: Born after 1996 — ages 18 to 28 in 2025
- Millennials: Born 1981 to 1996 — ages 29 to 44
- Gen Xers: Born 1965 to 1980 — ages 45 to 60
- Baby boomers: Born 1946 to 1964 — ages 61 to 79
- Silent generation: Born in 1945 or earlier — ages 80 and older
According to Bhatt, the fact that younger drivers struggle with speeding so much more than older generations isn’t unexpected.
“People tend to become more risk-averse as they age,” Bhatt says. “Younger drivers tend to be riskier than older drivers. They also don’t have as much driving experience as older drivers, so they may not be aware of things like appropriate speeds for driving conditions and how speed limits can change in different areas.”
Speeding habits among the young may also play a key role in why younger drivers pay higher insurance rates.
However, LendingTree analysts also see a drop in speeding-related incidents across all generations compared to previous years. Bhatt believes that drivers respond to the financial consequences after the first ticket.
“Once you’ve dealt with the cost of a speeding ticket,” Bhatt says, “you’re likely going to be more cognizant about avoiding another one in the future. This is the type of wisdom you gain with age.”
Once you’ve dealt with the cost of a speeding ticket, you’re likely going to be more cognizant about avoiding another one in the future. This is the type of wisdom you gain with age.

Infiniti drivers are speediest
For the most part, speeding-related incident rates stay very consistent across most car brands. Even so, a few differences stand out. Infiniti leads all vehicle makes when it comes to speeding-related incidents, with 3.5 incidents per 1,000 drivers. Tesla, Volkswagen and Mercury follow, with 3.4 incidents each.
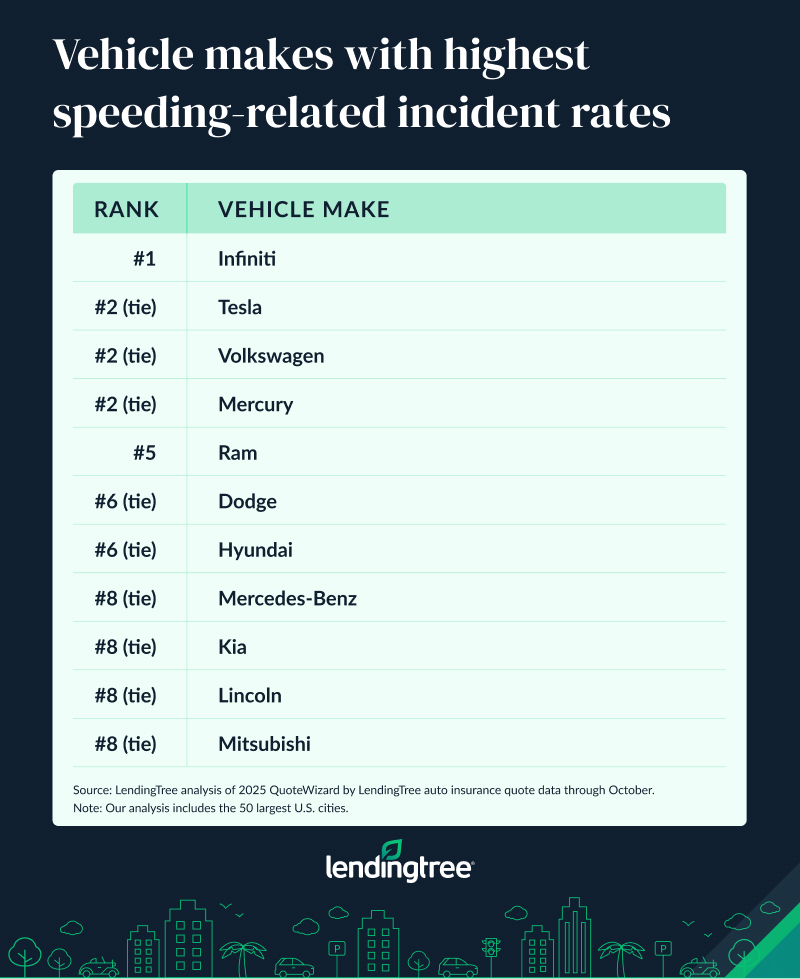
At the bottom of the list, Chrysler, Land Rover, Lexus and Cadillac tie, each with 2.2 incidents per 1,000 drivers. The small gap between the top and bottom, however, shows that drivers behave similarly across most makes.
Tesla and Volkswagen also ranked in the top 10 in our worst drivers study, where we looked at accidents, speeding, DUIs and citations.
Full rankings: Vehicle makes with highest speeding-related incident rates
| Rank | Vehicle make | Speeding-related incident rate per 1,000 drivers |
|---|---|---|
| 1 | Infiniti | 3.5 |
| 2 | Tesla | 3.4 |
| 2 | Volkswagen | 3.4 |
| 2 | Mercury | 3.4 |
| 5 | Ram | 3.3 |
| 6 | Dodge | 3.1 |
| 6 | Hyundai | 3.1 |
| 8 | Mercedes-Benz | 2.9 |
| 8 | Kia | 2.9 |
| 8 | Lincoln | 2.9 |
| 8 | Mitsubishi | 2.9 |
| 12 | Acura | 2.8 |
| 12 | Ford | 2.8 |
| 14 | Nissan | 2.7 |
| 14 | Pontiac | 2.7 |
| 14 | Honda | 2.7 |
| 14 | Chevrolet | 2.7 |
| 14 | Toyota | 2.7 |
| 14 | Subaru | 2.7 |
| 14 | BMW | 2.7 |
| 21 | Jeep | 2.6 |
| 21 | GMC | 2.6 |
| 21 | Audi | 2.6 |
| 21 | Buick | 2.6 |
| 25 | Mazda | 2.4 |
| 26 | Volvo | 2.3 |
| 27 | Cadillac | 2.2 |
| 27 | Lexus | 2.2 |
| 27 | Land Rover | 2.2 |
| 27 | Chrysler | 2.2 |
Speed is major factor in fatal crashes in North Carolina, Texas
Speed shows up in a large share of severe crashes in many cities. Raleigh, N.C., records the highest percentage of fatal accidents involving speeding — speed factors into 60.5% of fatal crashes there. Charlotte, another North Carolina city, also places in the top 10, with speed a factor in 41.7% of fatal car accidents.
The pattern stretches beyond the Carolinas. Kansas City, Mo., Portland, Los Angeles and Detroit all rank near the top as well. Finally, Texas cities account for three of the top 10 cities with the highest percentages of fatal accidents involving speeding: Fort Worth, Arlington and El Paso.
The high percentages suggest that speeding contributes to many of the most severe outcomes on the road. According to the Insurance Institute for Highway Safety (IIHS), higher speeds reduce reaction time and increase injury risk in a crash.
Meanwhile, cities with the lowest percentages of fatal crashes involving speeding show different patterns. Three of the bottom 10 cities are in Florida. Miami ranks last, with only 4.5% of fatal crashes being speeding-related. Jacksonville ranks near the bottom at 6.6%, and Tampa rounds out the Florida trio at 20.4%.
Full rankings: Cities with highest percentage of fatal crashes involving speeding
| Rank | City | Fatal crashes involving speeding | Fatal crashes | % involving speeding |
|---|---|---|---|---|
| 1 | Raleigh, NC | 23.0 | 38.0 | 60.5% |
| 2 | Kansas City, MO | 44.0 | 86.0 | 51.2% |
| 3 | Portland, OR | 30.0 | 64.0 | 46.9% |
| 4 | Los Angeles, CA | 134.0 | 310.0 | 43.2% |
| 5 | Detroit, MI | 52.0 | 123.0 | 42.3% |
| 6 | Fort Worth, TX | 45.0 | 108.0 | 41.7% |
| 6 | Charlotte, NC | 35.0 | 84.0 | 41.7% |
| 8 | Arlington, TX | 17.0 | 41.0 | 41.5% |
| 9 | Milwaukee, WI | 29.0 | 70.0 | 41.4% |
| 10 | El Paso, TX | 30.0 | 74.0 | 40.5% |
| 11 | Minneapolis, MN | 9.0 | 23.0 | 39.1% |
| 12 | Sacramento, CA | 24.0 | 63.0 | 38.1% |
| 13 | Tulsa, OK | 27.0 | 71.0 | 38.0% |
| 14 | Oakland, CA | 11.0 | 29.0 | 37.9% |
| 15 | Philadelphia, PA | 48.0 | 128.0 | 37.5% |
| 16 | Chicago, IL | 59.0 | 159.0 | 37.1% |
| 17 | Seattle, WA | 12.0 | 33.0 | 36.4% |
| 18 | Colorado Springs, CO | 17.0 | 47.0 | 36.2% |
| 19 | Long Beach, CA | 13.0 | 36.0 | 36.1% |
| 20 | Virginia Beach, VA | 13.0 | 37.0 | 35.1% |
| 21 | Houston, TX | 97.0 | 278.0 | 34.9% |
| 22 | Oklahoma City, OK | 33.0 | 95.0 | 34.7% |
| 23 | Dallas, TX | 68.0 | 198.0 | 34.3% |
| 24 | Tucson, AZ | 46.0 | 138.0 | 33.3% |
| 24 | Washington, DC | 13.0 | 39.0 | 33.3% |
| 26 | Denver, CO | 22.0 | 71.0 | 31.0% |
| 27 | New York City, NY | 67.0 | 220.0 | 30.5% |
| 28 | San Francisco, CA | 10.0 | 33.0 | 30.3% |
| 28 | Omaha, NE | 10.0 | 33.0 | 30.3% |
| 30 | Fresno, CA | 15.0 | 50.0 | 30.0% |
| 30 | Nashville, TN | 30.0 | 100.0 | 30.0% |
| 30 | Baltimore, MD | 12.0 | 40.0 | 30.0% |
| 33 | Mesa, AZ | 18.0 | 63.0 | 28.6% |
| 34 | San Jose, CA | 17.0 | 60.0 | 28.3% |
| 34 | San Antonio, TX | 49.0 | 173.0 | 28.3% |
| 36 | Phoenix, AZ | 84.0 | 299.0 | 28.1% |
| 37 | Austin, TX | 25.0 | 90.0 | 27.8% |
| 38 | San Diego, CA | 25.0 | 91.0 | 27.5% |
| 38 | Bakersfield, CA | 14.0 | 51.0 | 27.5% |
| 40 | Atlanta, GA | 21.0 | 80.0 | 26.3% |
| 41 | Louisville, KY | 28.0 | 114.0 | 24.6% |
| 42 | Indianapolis, IN | 26.0 | 114.0 | 22.8% |
| 43 | Albuquerque, NM | 24.0 | 106.0 | 22.6% |
| 44 | Memphis, TN | 47.0 | 220.0 | 21.4% |
| 45 | Las Vegas, NV | 8.0 | 39.0 | 20.5% |
| 46 | Tampa, FL | 10.0 | 49.0 | 20.4% |
| 47 | Boston, MA | 3.0 | 17.0 | 17.6% |
| 48 | Columbus, OH | 13.0 | 89.0 | 14.6% |
| 49 | Jacksonville, FL | 10.0 | 151.0 | 6.6% |
| 50 | Miami, FL | 3.0 | 67.0 | 4.5% |
Taking the slow road: Expert tips on curbing speeding habits
Speeding is not only dangerous — it can also cause your car insurance rates to spike. If you’re looking for ways to break the habit of speeding, Bhatt recommends the following tips:
- Maintain situational awareness. Scan the road, check your mirrors and pay attention to every speed limit sign. “You’re rarely going to get a speeding ticket for exceeding the speed limit by a small amount,” Bhatt says. “However, when you drive at an excessively high speed, you’re going to draw unwanted attention to yourself from law enforcement.”
- Relax and slow your pace. The minutes you save by driving faster rarely outweigh the risks. “Even when you have perfect control of your vehicle, another vehicle may not be able to react to you when you approach at an excessively high speed,” Bhatt says.
- Consider a high-performance driving school. Have a need for speed? Several programs offer controlled environments where you can drive at high speeds. They teach fundamentals of safe driving (which might even make you eligible for certain insurance discounts), and many schools allow you to drive your own car or use a rental. “There’s still an element of risk involved, so you have to be careful,” Bhatt says. “But these are environments where you’re not going to get a ticket for exceeding a speed limit.”
Methodology
Researchers analyzed tens of millions of QuoteWizard by LendingTree auto insurance quotes from 2025 through October.
Researchers calculated the rate of speeding-related incidents (speeding tickets or violations) per 1,000 drivers in the 50 largest U.S. cities by population. We followed the same process across these cities to determine the:
- Speediest drivers by generation
- Speediest drivers by vehicle make (among the 30 with the highest number of quotes)
To define generations, LendingTree analysts used the following ranges from the Pew Research Center:
- Generation Z (born after 1996; ages 18 to 28 in 2025)
- Millennial (born between 1981 and 1996; ages 29 to 44 in 2025)
- Generation X (born between 1965 and 1980; ages 45 to 60 in 2025)
- Baby boomer (born between 1946 and 1964; ages 61 to 79 in 2025)
- Silent generation (born in 1945 or earlier; ages 80 and older in 2025)
Finally, LendingTree researchers analyzed 2023 National Highway Traffic Safety Administration (NHTSA) Fatality Analysis Reporting System (FARS) data using the Fatality and Injury Reporting System Tool (FIRST).