Most Financially Fit Places in America
Financial fitness has little or nothing to do with how much you spend on gym memberships each month. But there are plenty of ways to measure financial fitness, from monitoring personal bill-paying activity to tracking cost of living regionally.
LendingTree researchers devised financial fitness scores for the 100 largest U.S. metros, taking into account five individual factors (such as the percentage of income that goes toward owning or renting a home and the percentage of people with at least one maxed-out credit card) and four community factors (such as unemployment rates and real personal income).
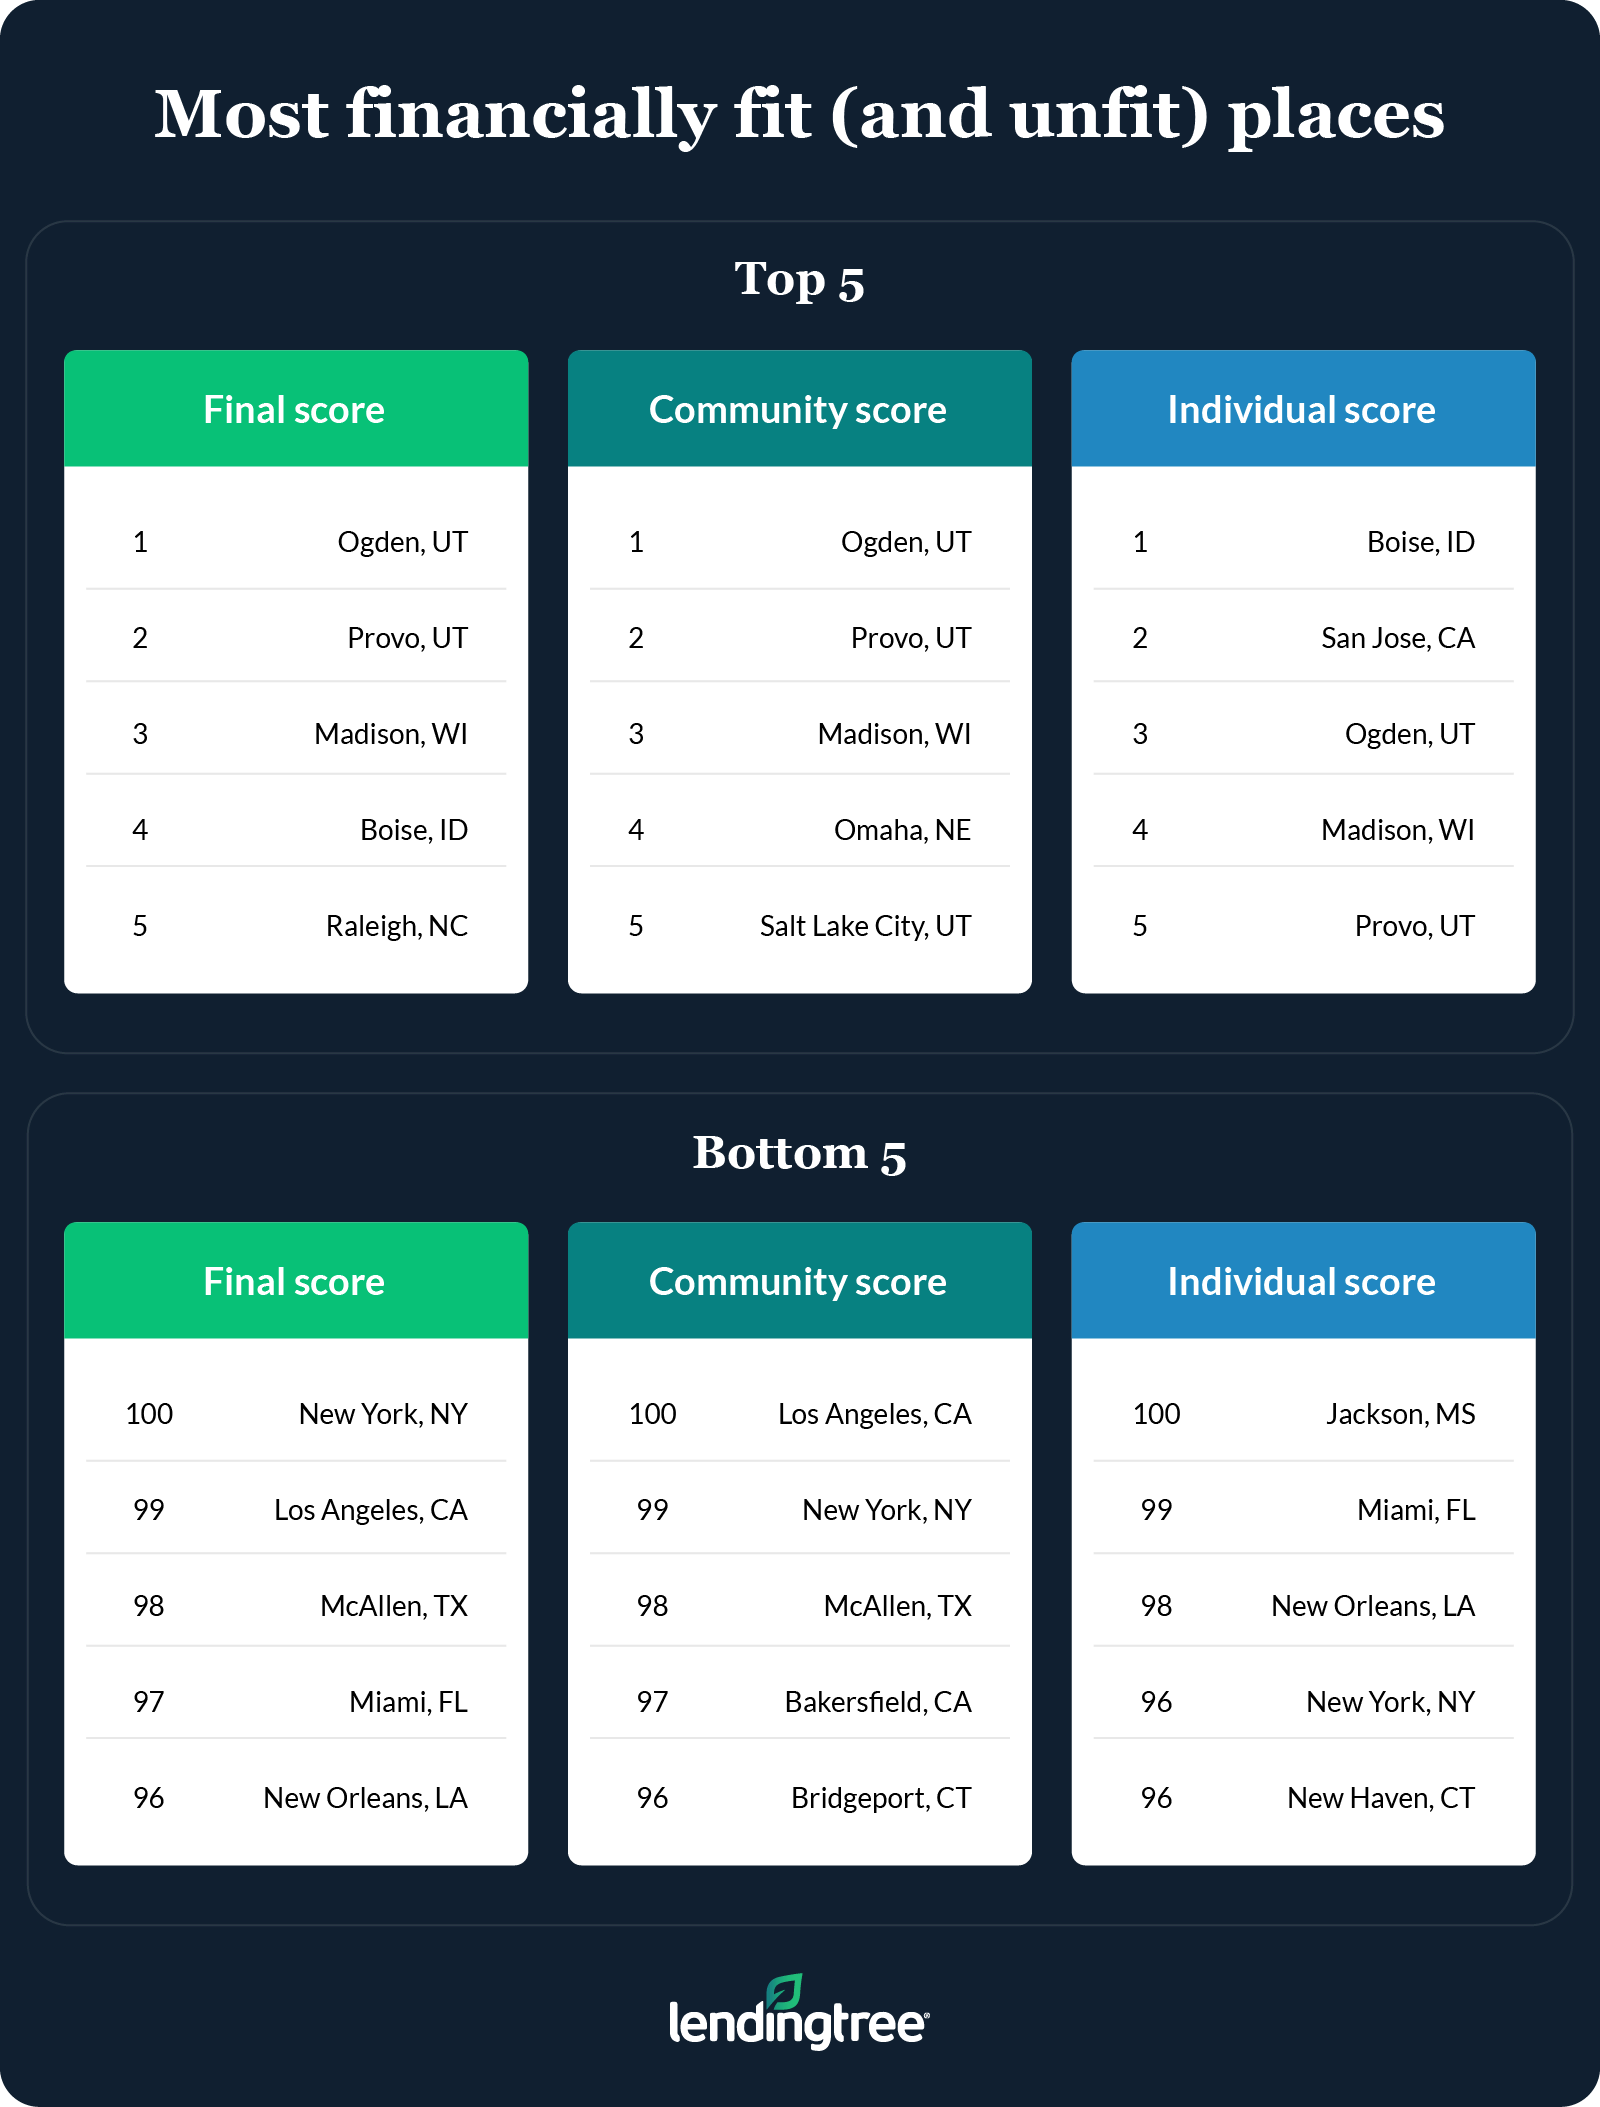
Two Utah metros come out at the top, while the two largest metros in the U.S. come out at the bottom. Here’s what else researchers learned.
Key findings
- Utah steals the show when it comes to financial fitness, with Ogden and Provo taking the first and second spots with final scores of 81.4 and 77.5, respectively. Salt Lake City makes a respectable showing at No. 8 with a final score of 70.2.
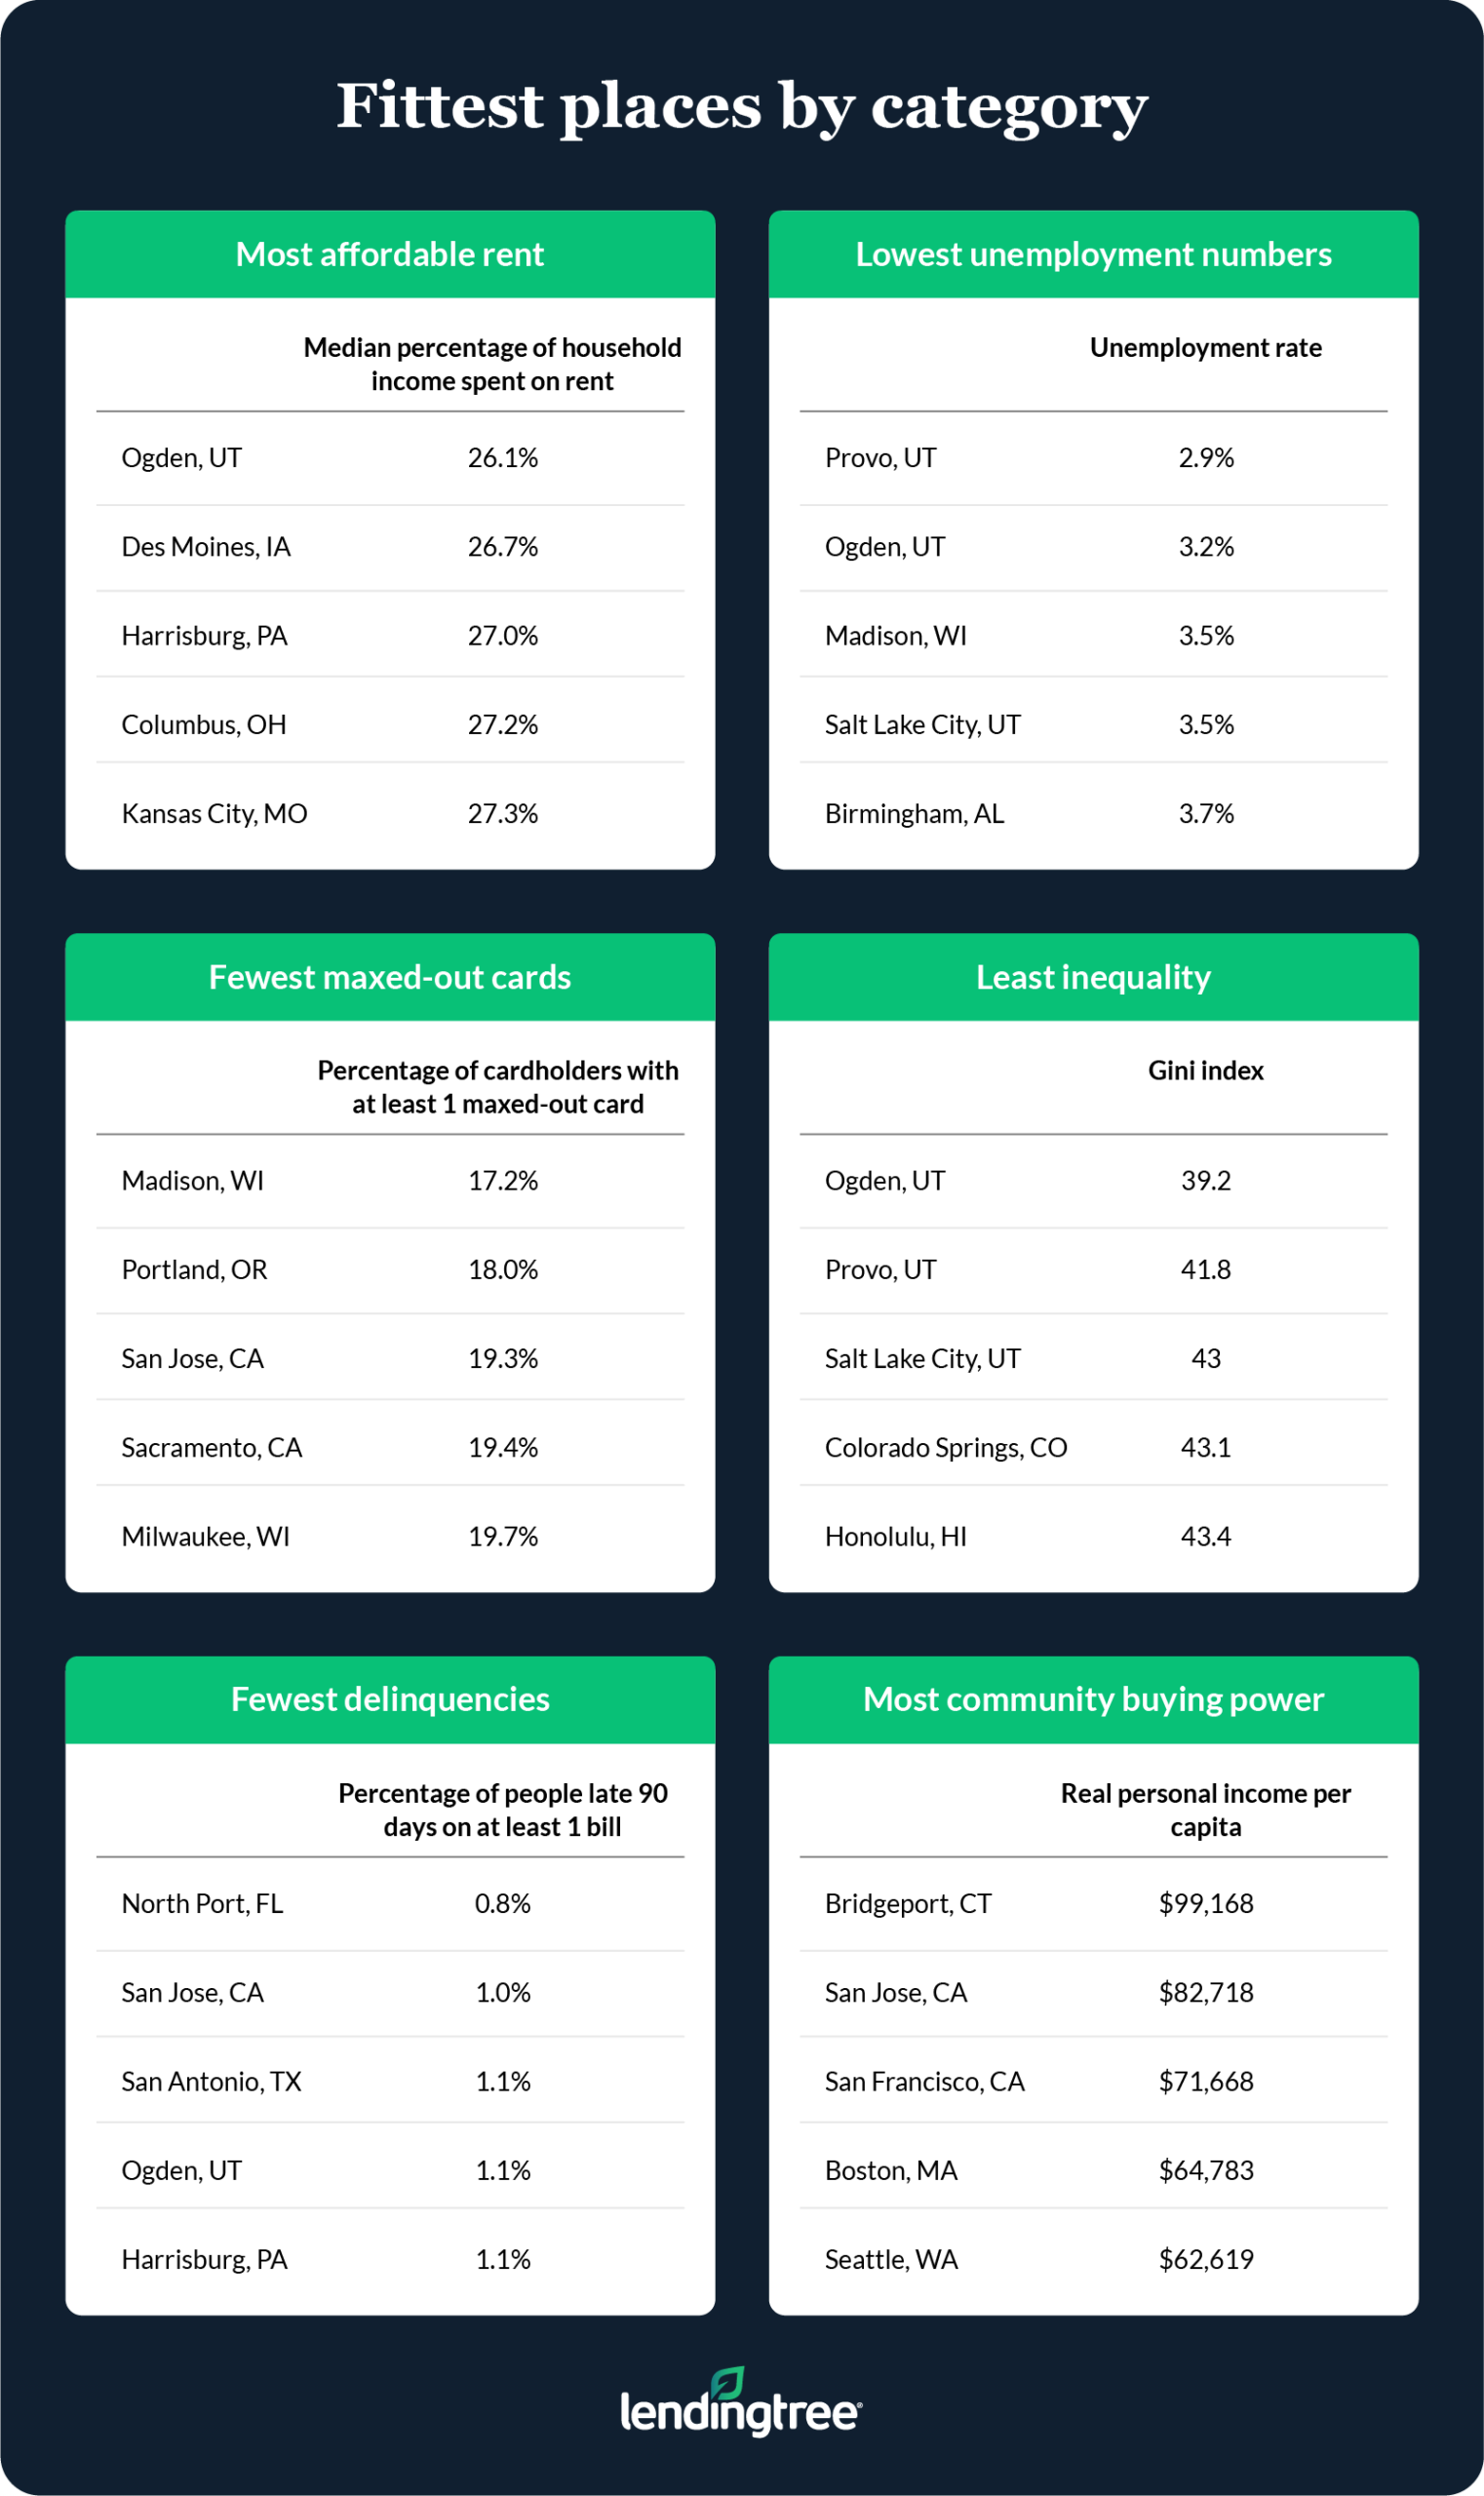
- Madison, Wis., rounds out the top three, with a final score of 76.5. Madison has one of the lowest unemployment rates — 3.5% — across the 100 metros examined.
- The two largest metros in the U.S. — New York and Los Angeles — finish at the bottom, with financial fitness scores of 32.5 and 34.6, respectively.
- McAllen, Texas, comes in third to last with a final score of 36.3. Despite being the cheapest place to live, this Texas metro has the lowest real personal income and the highest unemployment rate, so it’s no surprise that personal struggles with bills and debt follow.

5 most financially fit places in America
When it comes to overall financial fitness, it appears heading west to settle down might help. Of the top five most financially fit places in America, only one — Raleigh, N.C. — is outside the Midwest or West.
Outdoorsy individuals who might like to keep their physical fitness in check by skiing or hiking may find paradise in metros like Ogden or Provo in Utah, where LendingTree researchers also found key indicators of well-distributed financial fitness.
Check the methodology at the bottom for further context, but here’s a quick description of the categories examined:
- Regional price parity, which calculates the difference in price levels for goods and services across the metros in a given year
- Real personal income per capita, which accounts for inflation and incorporates the regional price parity (as well as a national index)
- Gini index, which highlights income equality across the metros
- Unemployment rate
- Median percentage of household income that goes toward homeownership costs
- Median percentage of household income that goes toward rent costs
- Average revolving credit utilization rate, which looks at how much of your available credit you’re using
- Percentage of cardholders with at least one maxed-out card
- Percentage of people at least 90 days late on at least one bill
- Unemployment rate
1. Ogden, Utah
Perhaps it “pays to live in Ogden” after all, as the Utah metro leads the rankings with an overall financial fitness score of 81.4. Residents of Ogden contribute to the community’s success by paying their bills on time and maintaining low credit utilization ratios.
Though personal habits will determine how financially fit an individual can be in any location, Ogden makes it a little easier with a relatively low cost of living and the second lowest unemployment rate of the metros that were ranked.
Additionally, Ogden is home to the most affordable rent prices of all the ranked metros, making it an attractive location for folks not ready to buy a home yet. Combine those rent savings with a growing downtown scene and Ogden might be a great place for young professionals.
2. Provo, Utah
Head south from Ogden to find the next best metro for financial fitness — Provo, Utah. With highlights similar to Ogden, Provo boasts the lowest unemployment rate (2.9%) and second-lowest Gini index score. Provo falls just a little short of Ogden in categories including personal income and cost of living.
3. Madison, Wis.
Standing out as the only Midwest metro in the top five, Madison, Wis., provides a relatively affordable option for folks eager to move to America’s Dairyland. Among the top five, Madison offers the highest real personal income per capita at $59,161, topping Ogden’s $44,907.
4. Boise, Idaho
Back out west, Boise, Idaho, finds itself toward the top of the rankings due in part to its low housing costs. Though 1 in 5 Boise residents reported having at least one maxed-out credit card, the average cardholder keeps their utilization healthily below 20% (and lowest among the top five).
5. Raleigh, N.C.
As the only representation from the South, Raleigh, N.C., rounds out the top five most financially fit metros. You won’t find another metro from the South until lower in the rankings — specifically, No. 17 (North Port, Fla.).
Though Raleigh has the worst unemployment rate of the top five at 5%, its low percentage of income going toward homeownership costs (16.9%) makes it a pretty affordable option for motivated buyers.
5 most financially unfit places in America
On the other side of the rankings, it shouldn’t be too surprising to see some metros notorious for their costliness. Though some of the wealthiest in the country may call these metros home, that doesn’t always make for a financially fit community.
1. New York
The city of high-rises and high prices lands at the bottom of the rankings as the least financially fit metro in the U.S. New York attracts workers across numerous industries looking to take a bite of the Big Apple, but many struggle to make ends meet in a place where households spend a median of 31.3% of their income on rent.
Despite offering an above-average personal income per capita, the cost of living in New York simply outweighs what would otherwise look like high earnings. Solid personal budgeting habits help New Yorkers stay afloat, but the metro’s conditions — including a relatively high 9.6% unemployment rate — make it that much more difficult.
Jay-Z wasn’t kidding when he said of New York, “Since I made it here, I can make it anywhere.”
2. Los Angeles
Those chasing a career on the silver screen might see their dreams come true in Los Angeles. But those looking for a place that enables them to live their most financially fit life might be better suited elsewhere.
Much like New York, high rent and homeownership costs often hinder Angelenos’ ability to get ahead on other debts and lead healthier financial lives. In fact, at 22.8%, L.A. has the highest median percentage of income going toward homeownership costs of all the metros ranked.
3. McAllen, Texas
Despite its lower rent and homeownership costs, McAllen, Texas, lands in the bottom five when all factors are considered. McAllen has the worst unemployment rate of all the metros ranked at 11.9%.
Additionally, researchers found the highest average revolving credit utilization rate in McAllen, which could be due in part to the fact that the metro also has the lowest real personal income per capita in the rankings. Evidently not everything is bigger in Texas.
4. Miami
The Magic City isn’t so magical when it comes to financial fitness. While a fairly average unemployment rate and personal income per capita make it seem like a decent opportunity to lead a financially well life, factors such as high rents contribute to Miami’s low fitness score.
Miami residents put the highest percentage of their income toward rent of all the metros ranked at 36.8%.
5. New Orleans
New Orleans has so much to offer for jazz lovers, foodies, history buffs and more. Unfortunately, it doesn’t offer the best environment for those seeking financial fitness.
Though NOLA owners only put about 17.1% of their income toward homeownership costs, renters spend a median 33.7% of their income on rent. This cost disparity was the worst among ranked metros.

Full rankings: Individual scores
Full rankings: Community scores
4 financial fitness tips
Location can certainly help you maintain financial fitness, but your personal habits will follow wherever you go, so make sure yours are helping you meet your financial goals.
1. Identify your goals
Achieving overall financial fitness often means addressing several different problem areas. Maybe you don’t have credit card debt but you struggle to keep a solid emergency savings.
“Knowing what you want most from your money is the vital first step,” LendingTree chief consumer finance analyst Matt Schulz said. “You have to know where you want to go before you can figure out how to get there.”
2. Make a plan
Once you’ve identified your goals, you’ll want to lay out a plan of how to achieve them.
“If you don’t know exactly how much money is coming in and going out of your household each month, it’s really tough to make a meaningful plan for your financial future,” he said.
3. Stay the course
Life can often impede on your budget, whether that means a sudden loss of income or another major unexpected expense. Financial fitness won’t stop those things from happening, but it can help mitigate the effects if you’re consistently working to improve your situation.
“Financial fitness is about good habits done over a long stretch of time,” Schulz said. “It is absolutely a marathon rather than a sprint.”
4. Use financial tools to your advantage
You might not think taking out a personal loan can help you get out of debt, but Schulz said debt consolidation loans can work for people juggling multiple payments.
“Not only can it knock down your interest rate, it can streamline your payments,” he said. “Instead of dealing with three or four different creditors, you can consolidate them into one loan, make one single payment and simplify your financial life tremendously.”
From checking your credit score to exploring products that can help you save, LendingTree Spring can be a valuable tool on your financial fitness journey.
Methodology
LendingTree analysts scored the 100 largest metropolitan statistical areas (MSAs) across two categories — community score and individual score — to determine the overall financial fitness of those MSAs.
These two scores were averaged to create a final score, upon which the MSAs were ranked from highest to lowest. The highest possible scores for each category and the final score was 100, and the lowest was zero.
Each metric was first scored according to its relation to the best value (100 points) and the worst value (0 points) among the metros. These metrics were then averaged according to the weights below to create the category score. The final score was equally weighted between the community and individual scores.
In addition to publicly available sources, researchers reviewed more than 300,000 anonymized credit reports of LendingTree app users. The composite metrics represent the latest data available.
Community score
- Regional price parity from the U.S. Bureau of Economic Analysis (BEA) (2019) — half weight
- Real personal income per capita from the BEA (2019) — half weight
- Gini Index from the U.S. Census Bureau American Community Survey (ACS) (2019 five-year estimate) — full weight
- Unemployment rate from the U.S. Bureau of Labor Statistics (BLS) (January 2021, provisional) — full weight
Individual score
- Median percentage of household income that goes to homeownership costs (ACS 2019) — half weight
- Median percentage of household income that goes to rent (ACS 2019) — half weight
- Average revolving credit utilization rate, anonymized My LendingTree user credit reports for January 2021 — half weight
- Percentage of cardholders with at least one maxed-out card, anonymized My LendingTree credit reports for January 2021 — half weight
- Percentage of people at least 90 days late on at least one bill, anonymized My LendingTree user credit reports for January 2021 — full weight
Get personal loan offers from up to 5 lenders in minutes

